The Leschi Lid
A look at how infrastructure decisions can shape a neighborhood’s finances
Hi Everyone, thanks for visiting this write-up (article? project?). To skip to the interactive maps I have made click here or scroll to the maps section.
Context and History
I live in Leschi. It is a gorgeous neighborhood with some amazing homes and parks, as well as sweeping views of, as well as access to Lake Washington. This view includes, of course, the I-90 bridge. This bridge carries some 157,900 vehicles per day between Seattle and Mercer Island daily. All of those drivers go through the tunnel.
Leschi and the Northern portion of Mount Baker have traditionally been single family home neighborhoods with very little alternative zoning. Most days I have the privilege of walking about one mile south from my home, right by the Grace United Church to work/play at the beloved Amy Yee Tennis Center. These walks, which sometimes go through Sam Smith park and sometimes stay on the ridge give me plenty of time to think about the history of the neighborhood and it’s built environment. Particularly when it comes to the highway.
Why was it made as a tunnel? Why are some nearby highways not tunnels? Does this Tunnel/Lid benefit us? To what degree? What would daily life in the area be like if the powers that be had chosen to send the highway over rather than through the hill?
When I think of these questions, I can’t help but think of the socio-economic makeup of various parts of Seattle. This 1936 map, originally made with the Federal Housing Administration, digitized and annotated by the University of Richmond details the ‘Grade of Security’. This depiction of Seattle splits the city into five distinct categories, ‘Best’, ‘Still Desirable’, ‘Definitely Declining’, ‘Hazardous’, and ‘Business/Industrial’.
Leschi and Mount Baker as we know them were preserved by a decision made sometime in the 1930s. The Mount Baker Tunnel was completed in 1940. The original tunnel went below land exclusively in the ‘Still Desirable’ category of the 1936 FHA map. That map shows a neighborhood, called ‘Area B14’ which is described as “principally of the white-collar, professional and businesses types. The citizens have moderate to well-to-do means.”. If the area had a different makeup would the infrastructure investment have looked different?
In the 80s and 90s the Tunnel was expanded and the ‘Lid’ was added. The lid is the section that goes from 23rd Ave in the west to 29th Ave on the eastern portion, allowing for Sam Smith and Jimi Hendrix Parks. For the purposes of my analysis I have treated the Tunnel and The Lid as the same.
I am not sure if it was a tough decision nine decades ago to bore this tunnel. According to Seattle Times excerpts from the 1930’s featured in this recent (2020) article the tunnel’s projected cost was $935,000 ($21,122,769 in 2025 dollars), which panned out to be ‘about $1,400,000’ ($31,627,676 in 2025 dollars) after some cost overruns. The entire project, including the bridge from Mercer Island to the tunnel in question ended up at $8,450,000 ($190,895,616 in 2025 dollars). I should also note that there was at least some sentiment against the project as a whole at the time with Seattle Times Associate Editor James Wood calling the idea of adding a bridge ‘A gross and wholly unnecessary obstruction….hideous at all times’. I’m showing some restraint by not quoting more of Wood, he had some spicy things to say.
The previously mentioned Lid, spanning from 29th to 23rd cost $400 Million ($1,718,106,350 in 2025 dollars) when it was built in 1990 according to ‘The Aberdeen Group’.
Current Status and Project
Today, the area has tons of growth. (Slightly) Relaxed zoning laws allow for more types of housing to be built in the area. Take for example the Shelter Homes development at 1301 31st ave S, a former gas station that is now becoming ten(!) different million plus dollar townhomes. This type of enormous change is being seen all over Seattle with tons of lots being converted into denser and denser housing. This particular change is however not yet represented in the parcel and tax data that I have as they still have a couple of months until completion. This time next year the County will likely be collecting a million dollars in property taxes from the entire lot.
To study the lid, I am using the property values of land in the area surrounding the footprint of the tunnel/lid to estimate the overall financial impact that the project has had on the neighborhood. Luckily for me, property values are a matter of public record and are available with data on their associated parcel on the King County Website. Yippee! All data used will be linked at the bottom.
The parcel data I am using has both appraised land value and appraised improvements value. For simplicity I chose to combine them for the purposes of this analysis, but examining the differences can be very interesting. For example the Shelter Homes development will result in that same parcel of land paying dramatically more total tax than it was before. Should we be punished for developing land and incentivizing underdevelopment? Personally I think I don’t understand the full implications of these distinctions and would love to learn more. If you are interested there is an economic ideology called Georgism dedicated to a Land Value tax; in other words not taxing the improvements made on a lot.
For this study I am assuming that having a highway through a neighborhood affects the property values of land up to about 7/10th of a mile away. Using this assumption I took the data on all of the land in that zone and east of 23rd ave and made a rudimentary calculation of how much property tax that section paid.
| Tax Type | 2025 Dollar Amount |
|---|---|
| Total Appraised Land Value (Excluding Improvements) | $2,329,722,585 |
| Total Appraised Improvement Value (Excluding Land Value) | $2,032,736,707 |
| Combined Land and Improvement Value | $4,362,459,292 |
| Combined Land and Improvement Value Divided by the relative distance from Tunnel | $2,227,889,861 |
Maps
Total Parcel Value Map
I’ve produced four maps to help illustrate the status of property values in the area. First I have the simplest of the maps depicting the value of each parcel in the study area. Hover over a parcel to see its exact valuation (Property + Improvements).
Tax Value per Square Foot Map
This next map shows property values per square foot. The darker blue/purple color indicates less value per square foot while the lighter orange/yellow colors indicate higher value per square foot. I had to manually adjust this map because one lot in particular, Verse Seattle, an apartment building on the southwest corner of 23rd/Jackson with studios going for nearly $1700 was such an outlier that it made the rest of the map significantly less legible. So I took it out. For more context the Verse has a valuation of $35,258,000 ($33,299,400 of which is improvements) and a lot square footage of 9793 making for a $ per SQFT of over $3600!! That is more than 20 times bigger than a lot of the single family homes in this study area. The lot with the next highest $ per SQFT happen to be right next to the Verse and are the Abbey Lincoln Court Apartments, which are officially designated as low income housing. This lot and its improvements are valued at over $1840 dollars per square foot. Not low income for the County!!! (Side note - I’m not actually sure if the County collects property tax on this parcel - I just wanted to drop that sick line).
Separately, note how the tax per square foot is much higher on the subdivided lots. For example take a look between 23rd and 25th, North of Plum and South of Holgate. A whole bunch of dense housing, providing people with homes and the County with money to operate.
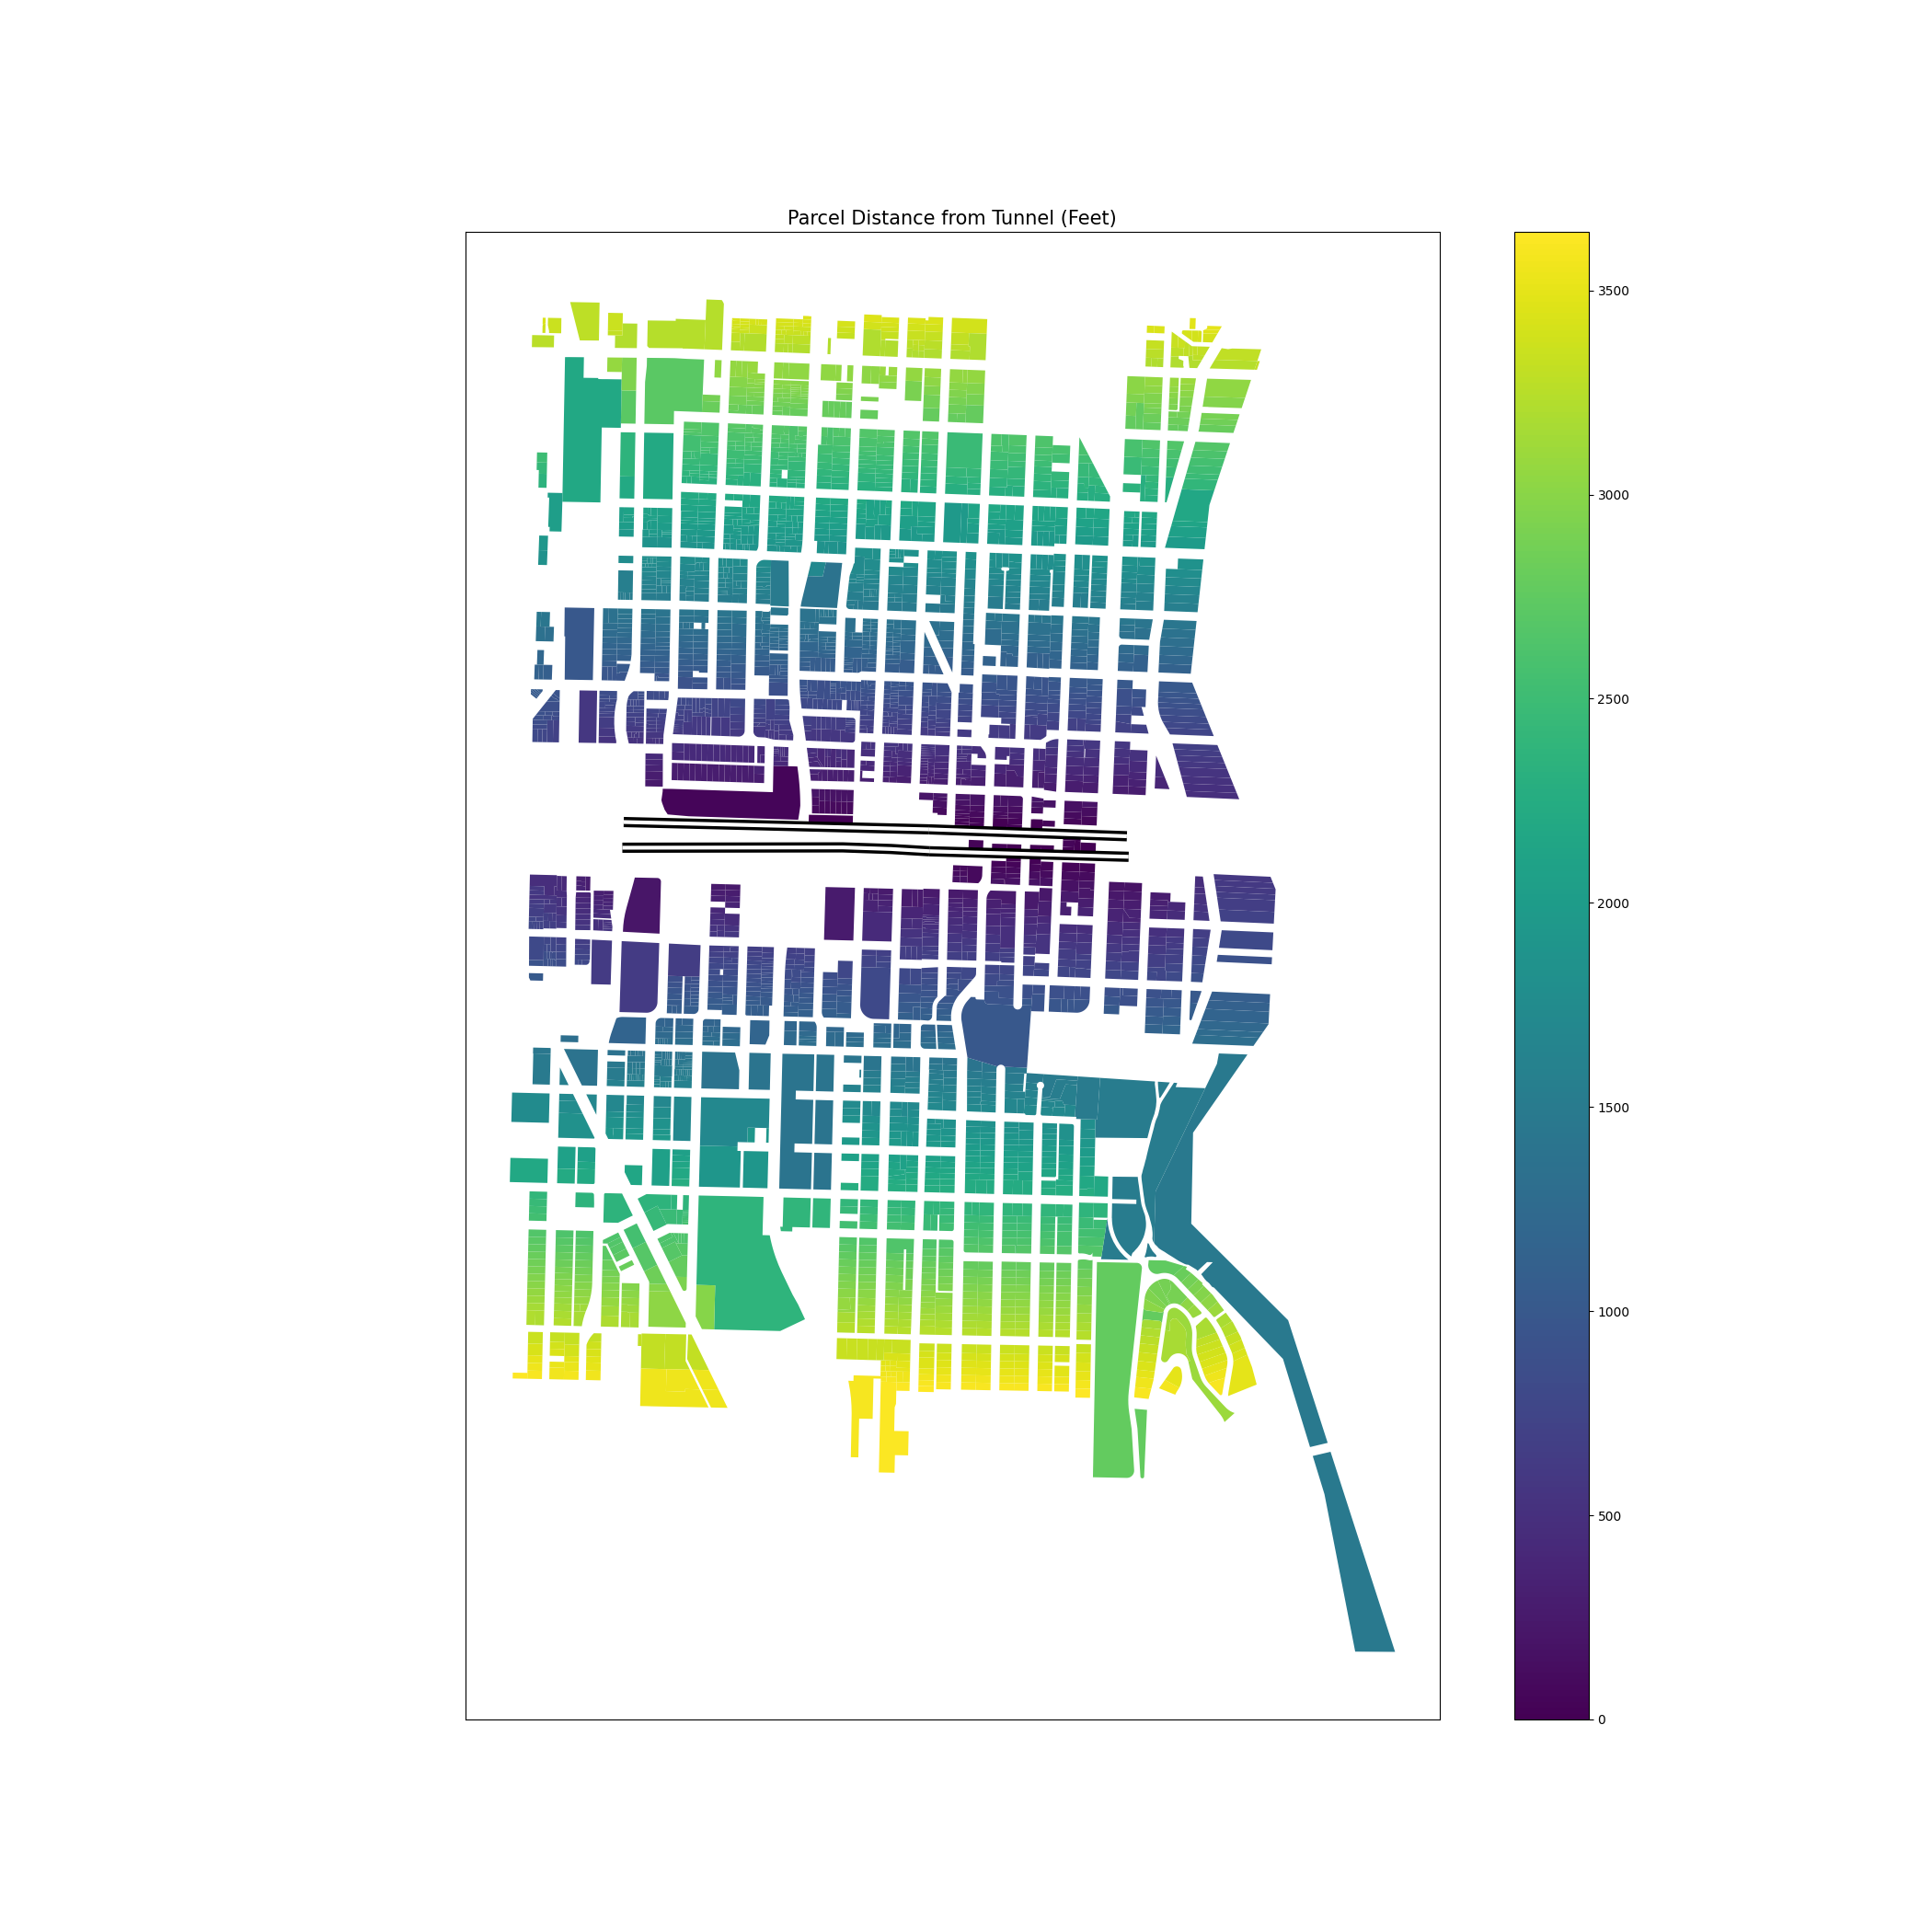
Now I am going to incorporate the factor that makes this project what it is. The distance from the tunnel. The static map below shows the study area and all of its parcels, shaded by the distance away from the tunnel which appears in black/white in the middle of the image.
Tax per Square Foot divided by Distance Map
Finally we have the property values per square foot multiplied by the distance away from the tunnel. For the distance calculation I did a simple 1 - (distance / max distance) to get a percentage representing how far the parcel is from the tunnel. Then I multiplied that number by the tax per square foot to get the numbers shown on this map. See the Tax_per_SQFT_X_Distance number to see the exact results.
It all culminates in this number –> $2,227,889,861. Comfortably over Two Billion. That is the approximated appraisal, both in property value and improvements that the lid is responsible for. Some of that number comes from parcels that literally would have been torn down, and some comes from the increased value of all the properties nearby, (not so) passively benefiting from the lack of an audible and visible highway in their backyards.
Thanks for reading! I had a great time working on this and am glad to know more about where I live. View the code used to come up with the numbers and make the maps here, the parcel data here and the tunnel data here.