Mountlake Terrace Commuting
Hello Readers!
Today I wanted to do an investigation of United States LEHD Origin-Destination Employment Statistics (LODES). The LEHD, which stands for Longitudinal Employer-Household Dynamics, is a branch of the US Census who does incredible work helping us understand the habits of the American workforce with statistics detailing commutes, salaries and more.
Today I used these data to take a look at habits of Washingtonians and took the chance to pay special attention to a sleepy town a few miles north of Seattle, called Mountlake Terrace.
Before examining only Mountlake Terrace lets take a look at statistics from the entire Combined Statistical Area (CSA), which includes Tacoma, Seattle, Bellevue and the surrounding regions.
Here are the dwelling locations of all residents in the CSA and then the locations of all jobs in the CSA.
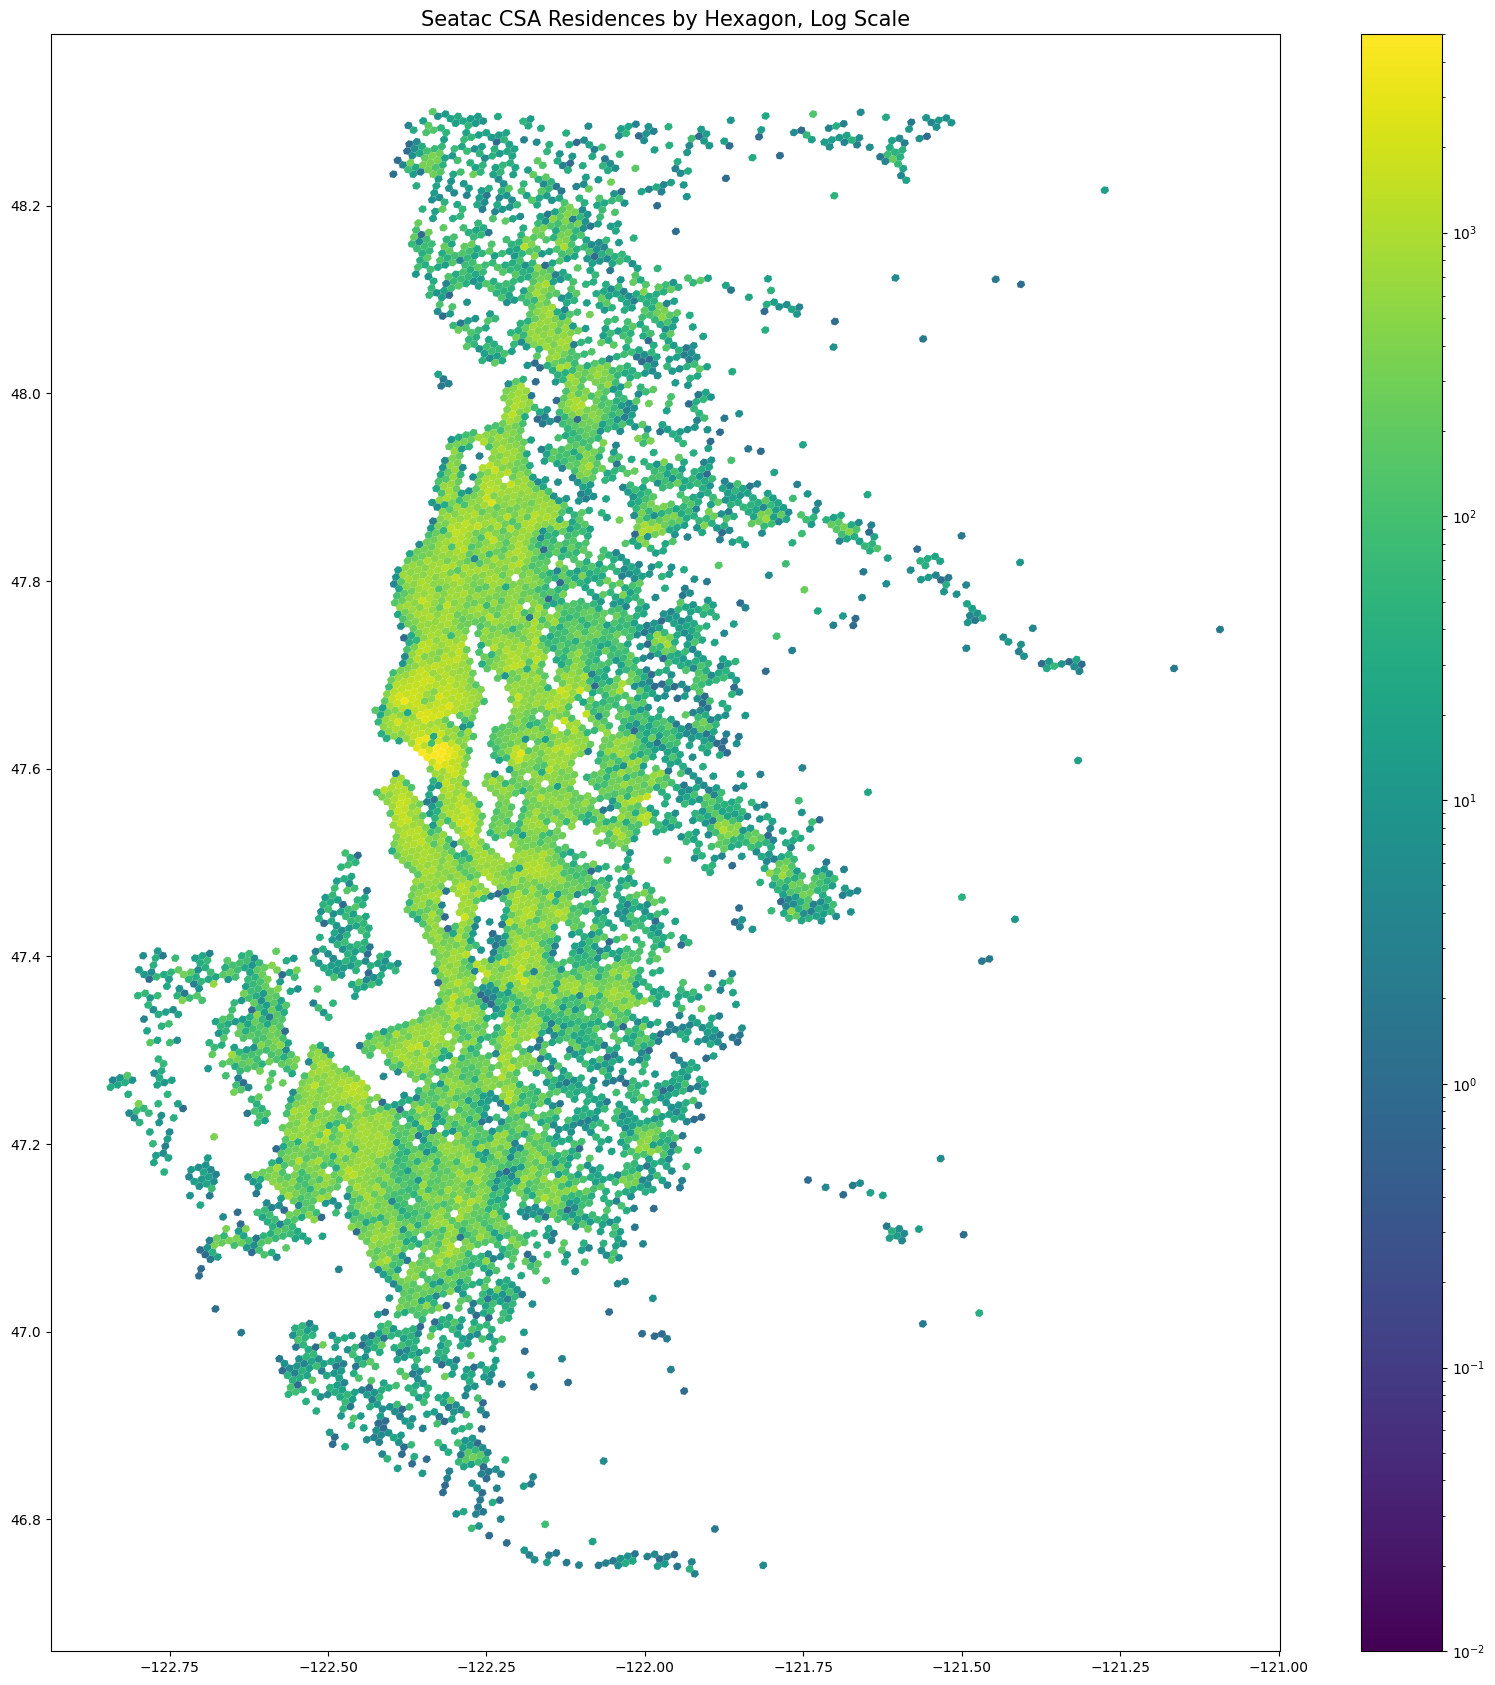
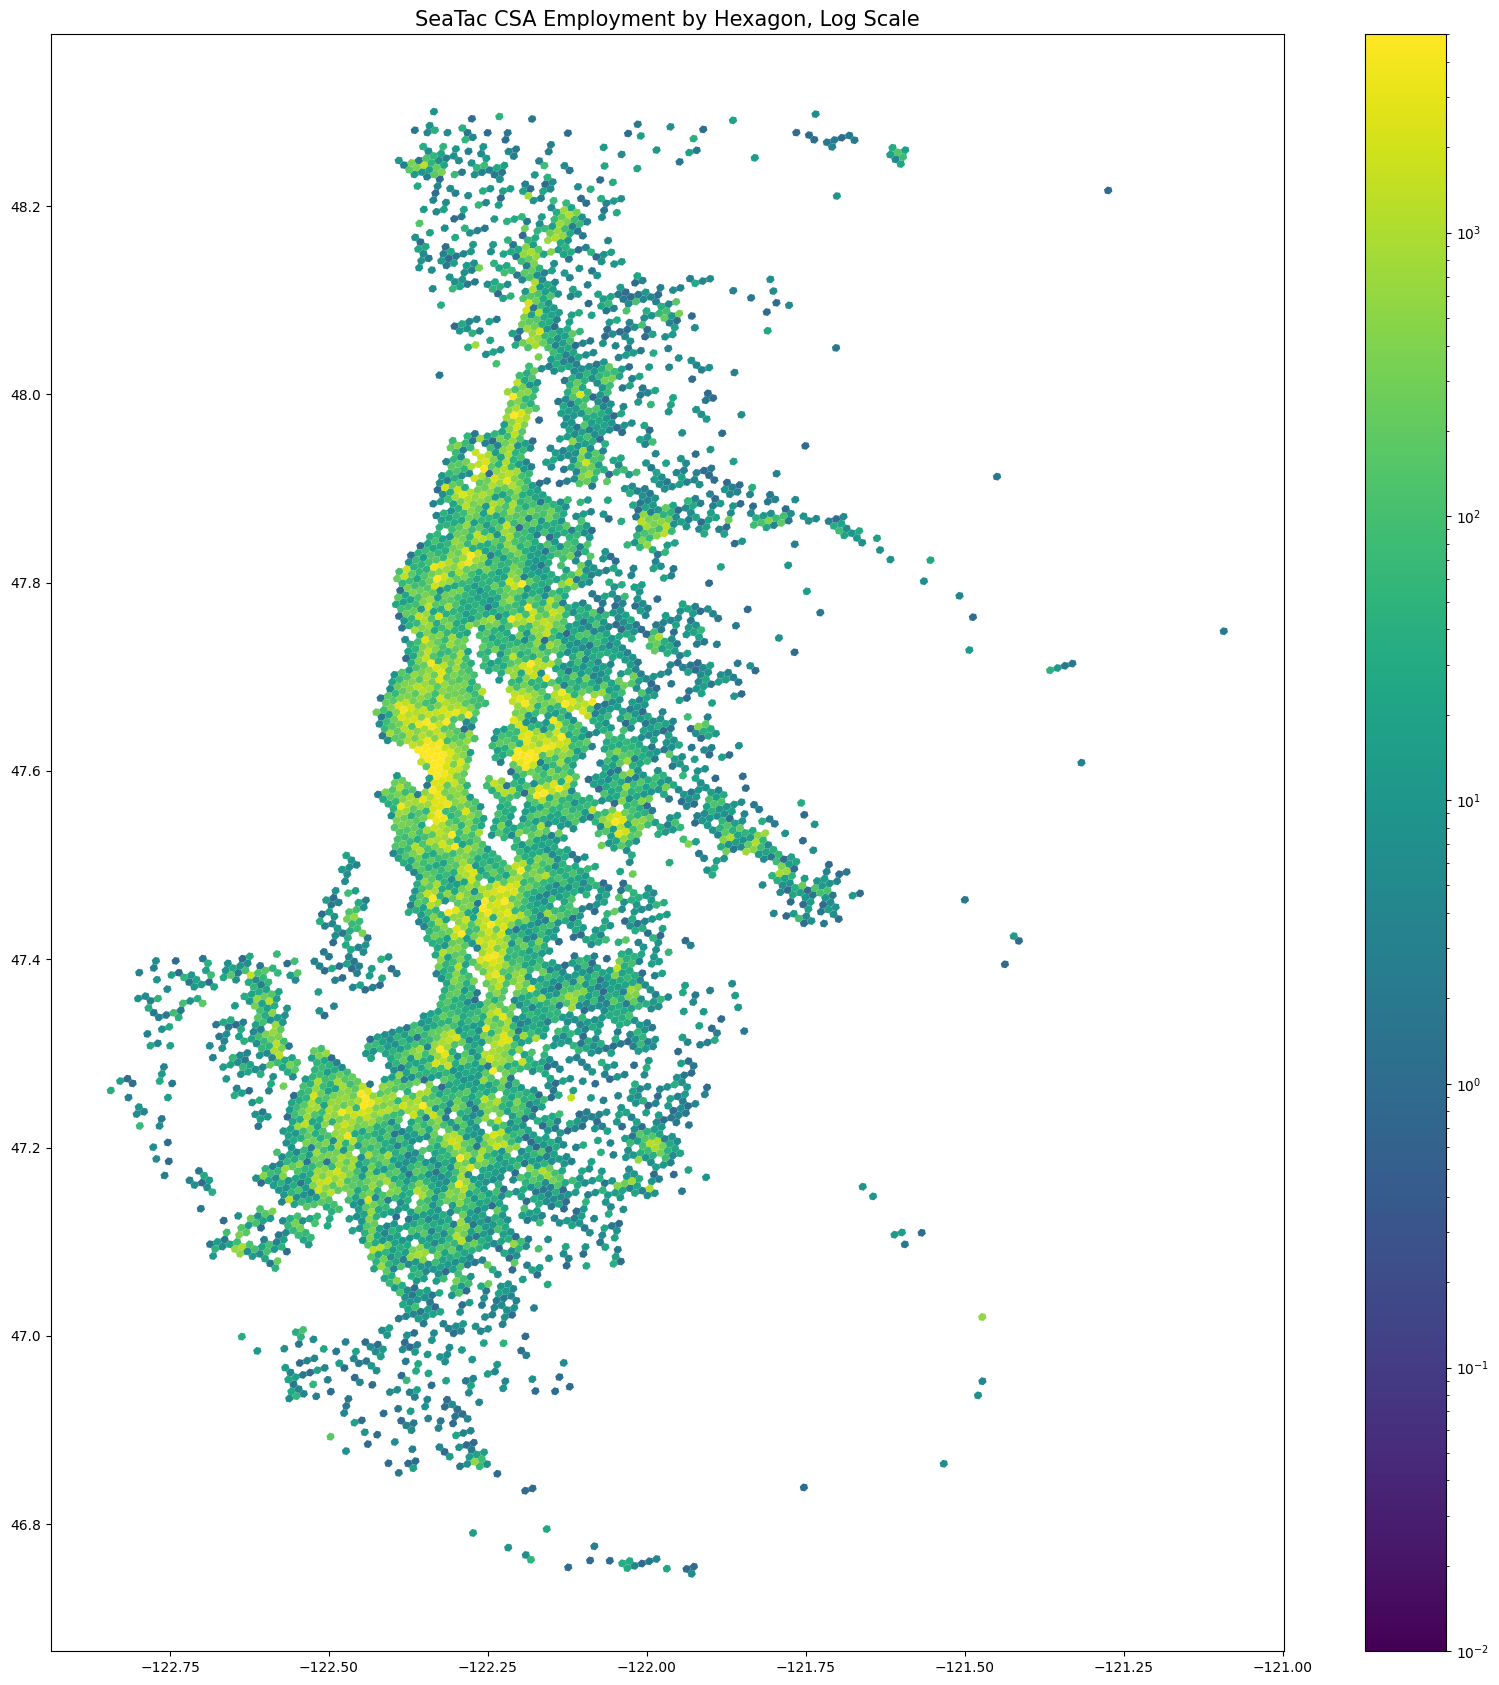
You can see in these two maps, both of which have a logarithmic scale, that there is a much more even distribution of residences across the map than there are jobs. This makes sense intuitively. People typically work in the business district and office buildings are quite a bit more dense than housing!
A few miles north of Seattle, well within the metropolis’ Combined Statistical Area (CSA) you find the small city of Mountlake Terrace.
Mountlake Terrace has grown modestly in the past couple of decades, with a 2002 population of 20,638 and a 2022 population of 21,543, absent of an significant spikes or dips.
It will be fascinating to see how the connection of the Link LightRail to Mountlake Terrace effects the population trends and commuting habits of Mountlake Terrace. If you look close at the upcoming Hexagon map you will be able to see that some of the areas with the most jobs held by Mountlake Terrace Residents are extremely close to Line 1 light rail stops. Will these residents be willing to use the light rail? Will more central Seattle workers make the move up north? We will see.
The below map is Mountlake Terrace Specific Data. We see here a display of the workplace of all Moutlake Terrace Residents. The number that you see upon hovering represents how many Mountlake Terrace Residents have jobs in that specific hexagon.
You probably noticed that there are Hexagons all over the state. Even three in Clarkston, a full 5 hour and 30 minute drive away! I can’t be totally sure what the lives of those three people look like, or the couple dozen working in Spokane, but they represent a tiny portion of Mountlake Terrace commuters.
Of the 10,488 people who live in Mountlake Terrace and are represented by the LODES dataset (people with jobs), 3755 of them work in the City of Seattle, while 9861, or over 94 percent work in the Seattle/Tacoma/Bellevue combined statistical area. Interestingly, only 2978 of them work in their home county of Snohomish.
Now lets take a look at a different visualization method that will be able to show both the ‘origin’, or the home of the individual and their ‘destination’, aka workplace. Note that due to the individual nature of this visualization, it is difficult to appreciate how much more dense the employment is in central Seattle than it is in other areas, such as Spokane. I’ll stick to Hexagons for that!
There is a lot more investigation into the numbers and visualization of this LODES data that can and should be done. In Mountlake Terrace and beyond there are always interesting new trends and patterns to uncover, so stay tuned for more.
Thanks for reading!
See the code that I used to do this work here. And if you are interested in the Data itself I got it from the Census LEHD site here.