Daily Vehicle Miles Traveled in Austin
I am currently working on examining traffic patterns and mobility in Austin Texas! I did a somewhat similar study a few months ago, and now im looking from a different angle. TXDOT publishes a huge data set ever year called the ‘Roadway Inventory’ that is just under 200 columns and has data on every roadway in Texas. For this study I will be focusing specifically on the Daily Vehicle Miles Traveled (DVMT).
Take a look at all the roadways in the city of Austin.
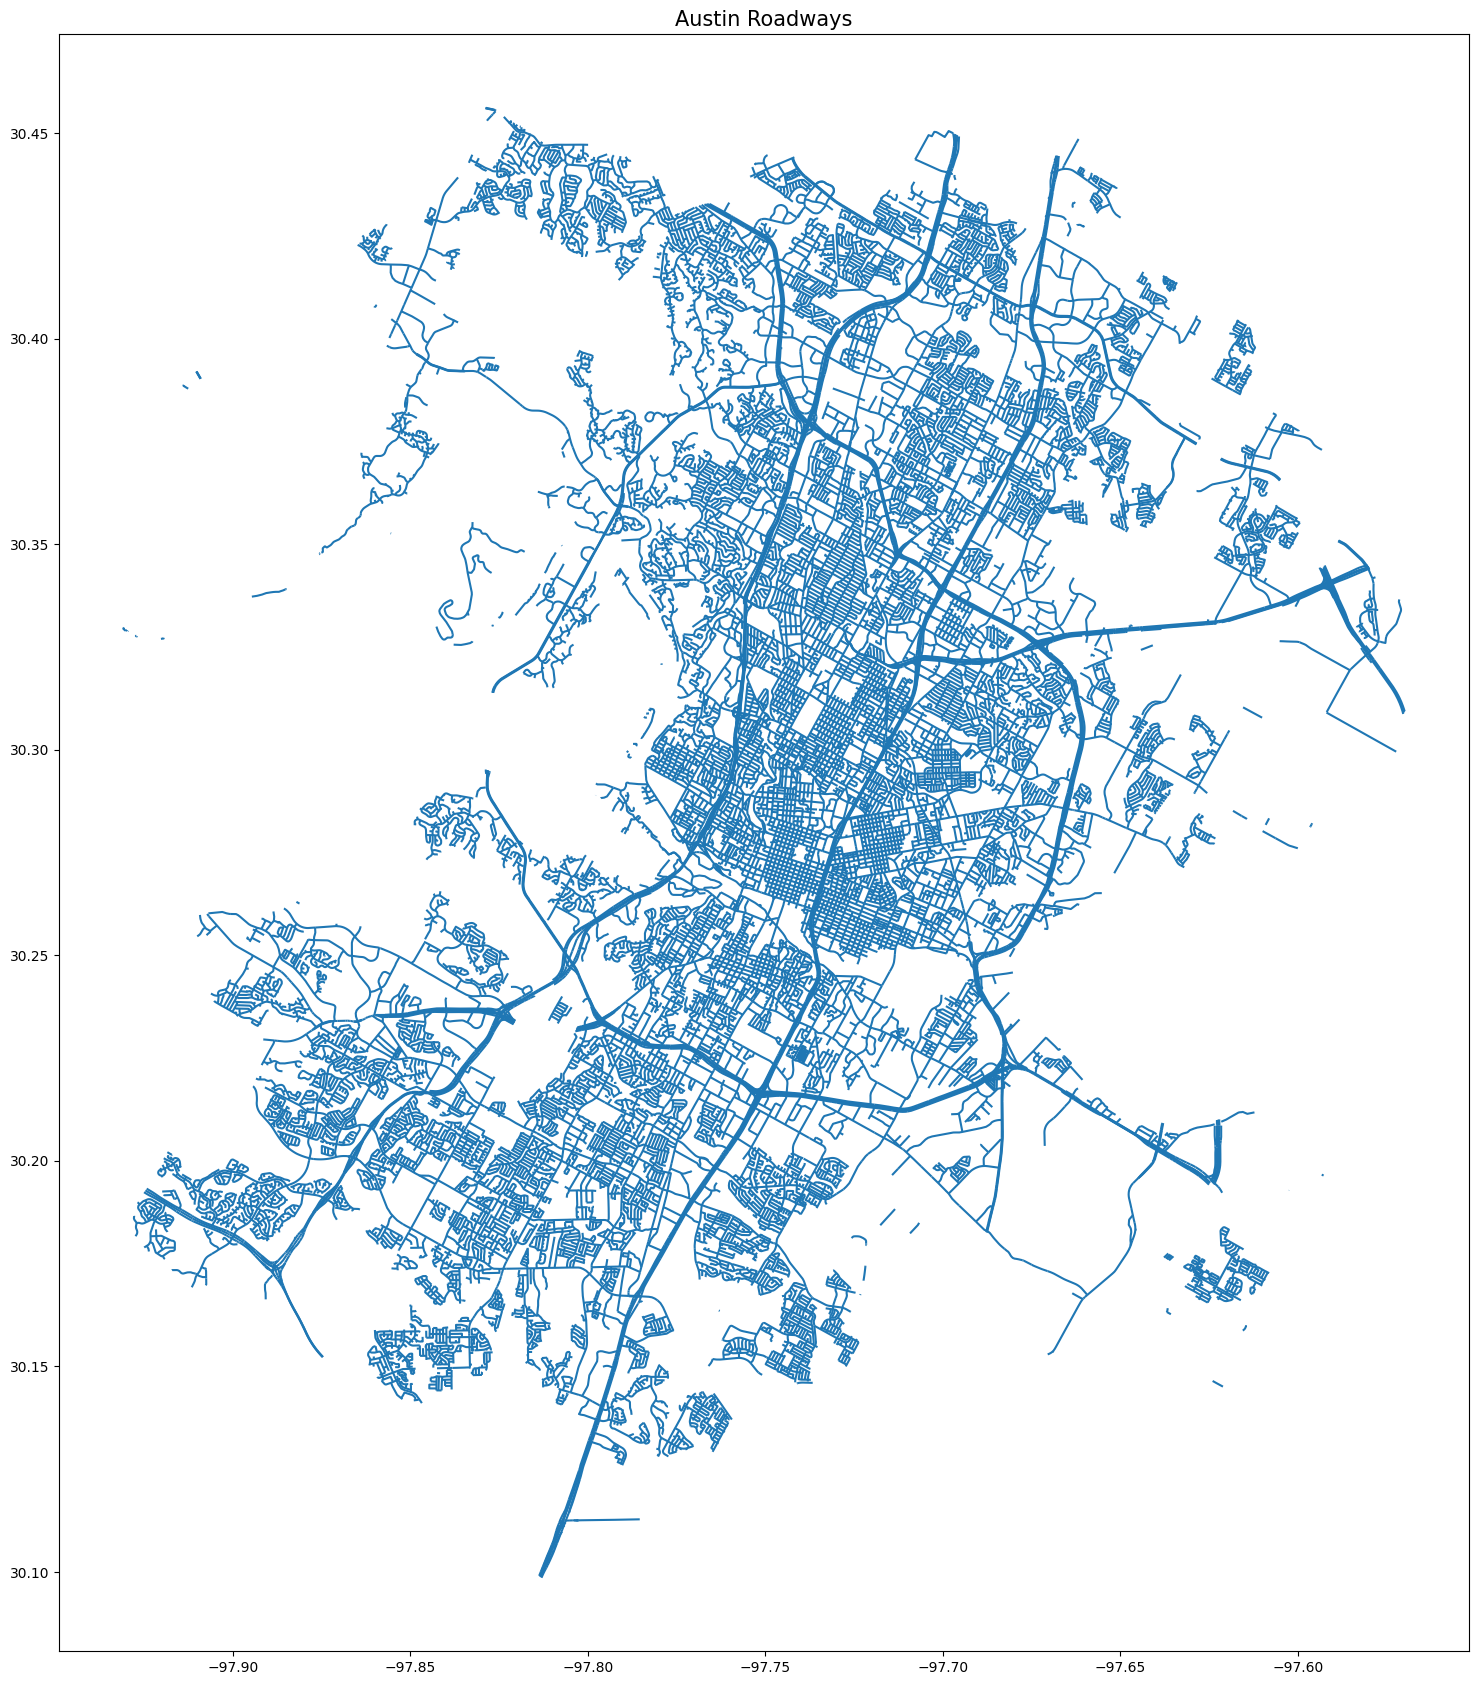
This data set has that but for the entire state of Texas! Wild.
Becuase there are so many road segments in the city of Austin, trying to communicate visually of all that information to say something meaningful is quite difficult. That is where hexagons come in! As you may recall from your favorite board game, Settlers of Catan, or looking at a Beehive, hexagons have the ability to cover area in a very regular and complete way in a way that most other shapes cannot.
For this project I converted all the line segments representing the roadways into points at the very middle of the segment. This method does come with a small amount of lost precision, but that is part of the deal when communicating so much information! After converting all the segments to points, those points were able to fit in neat hexagons. The interactive map below displays all of those hexagons, with the color gradient representing the DVMT of the hexes.
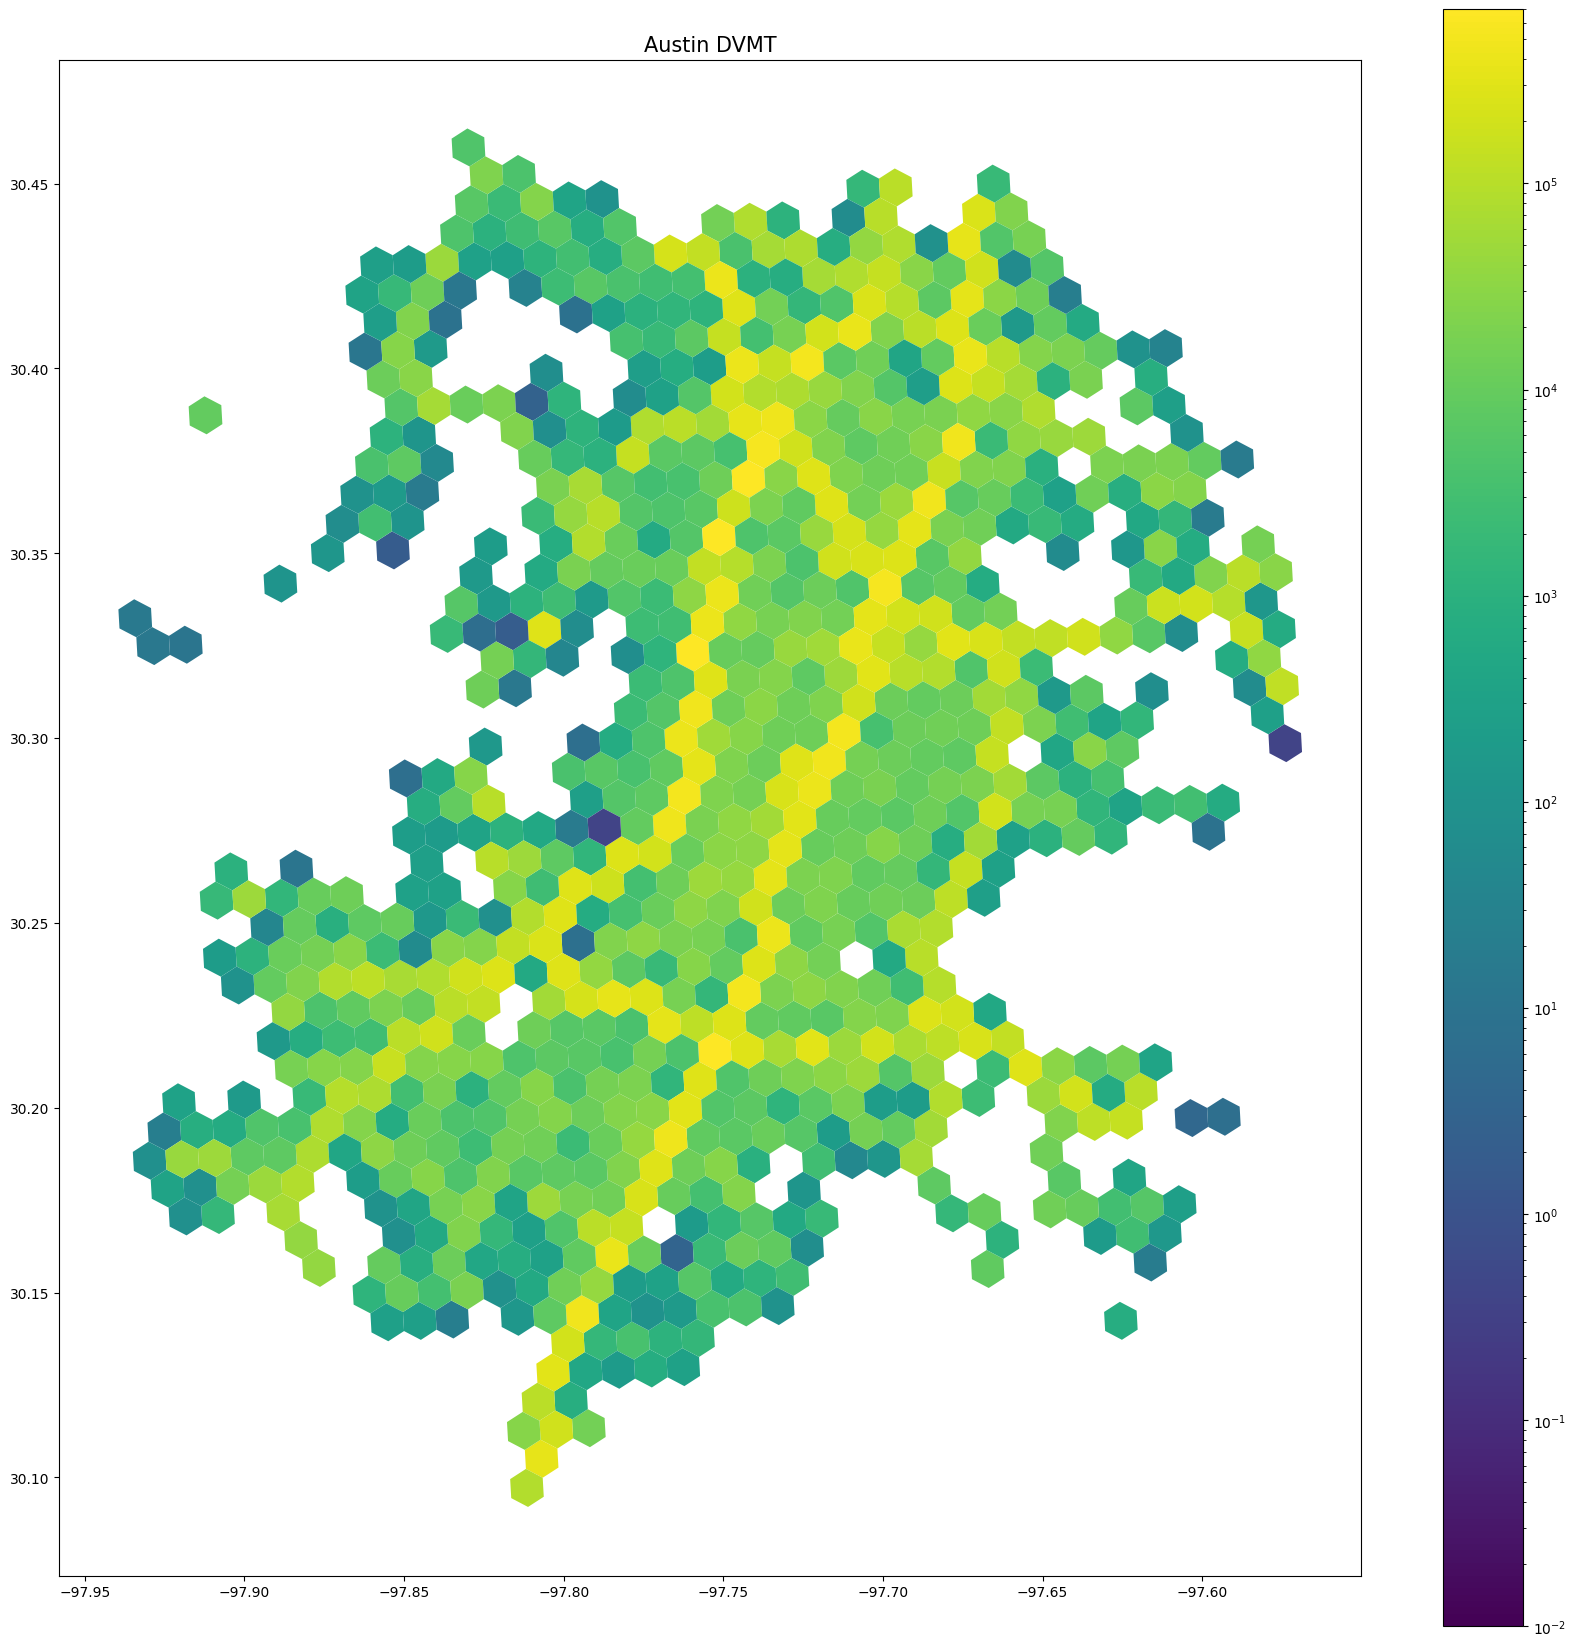
As you can see, most of the hexagons above are purple, near the bottom end of the scale. Becuase of the huge range (from double digits all the way to 795,904) of DVMT in the hexes, it is difficult to properly represent with a linear scale. Below is a map of the same hexagons in a logarithmic scale. We can still see the clear outline of the highways, but also we can clearly see more DVMT in central areas of Austin.
Finally lets look at another visualization solution. Rather than having a gradual scale I have split the hexagons into ‘bins’, making the representation categorical.
Thanks for reading! I hope you enjoyed all the Hexagons. This is part one of this project, In part two I will be attempting to incorporate census commute data to try to find some more interesting insights into the traffic patterns that we can see above. Thanks to TXDOT for the data, which you can find here. See my code that I used to make all this here.