A look at Seattle's Land Use and Tax Income
Today we are looking at Seattle’s Land Use and how it relates to its Tax income.
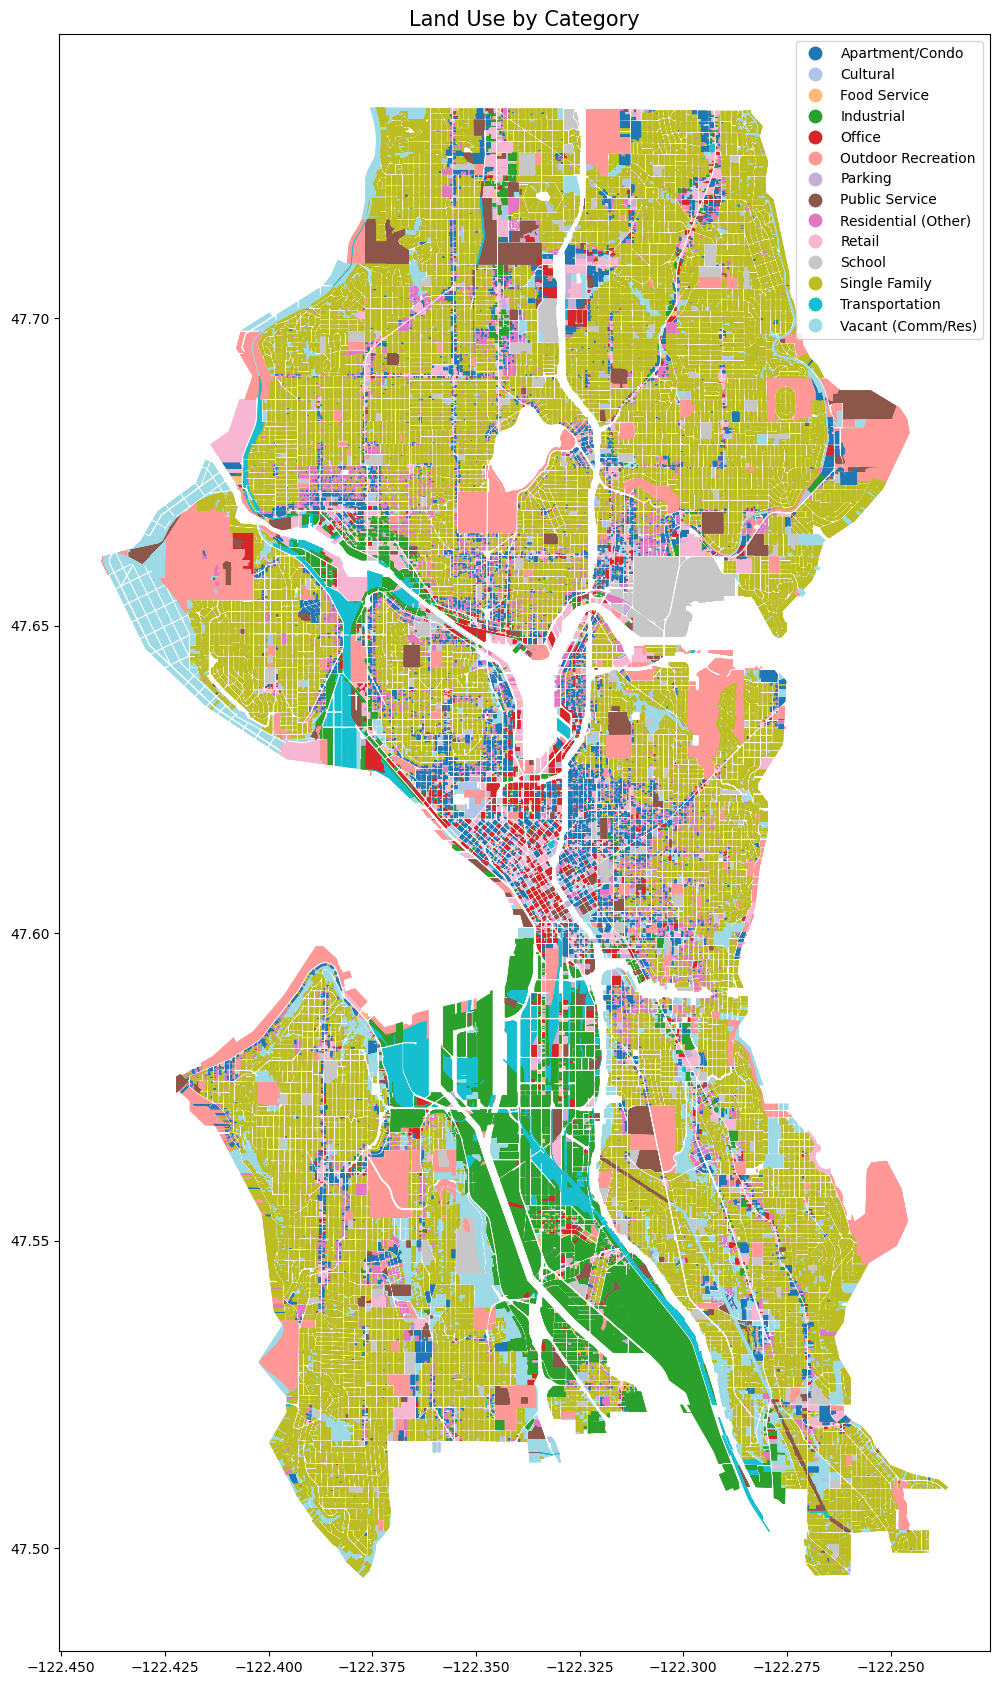
Thanks to King County, we have access to geographic data about each individual parcel in the entire county, which I was able to combine with a different data set containing information about each parcel’s tax payments. A parcel is also known as a lot. One entire apartment building, for example, represents a single parcel.
The original data set categorizes each one of the 750,540 parcels in Seattle into one of 115 different sections with categories as mundane as ‘Office Building’ or ‘Bank’ to slightly more surprising land uses such as ‘Fraternity/Sorority House’ or ‘Tavern/Lounge’.
For the sake of chart legibility, I aggregated those 115 categories into 14 different groups and charted the land use of them all.
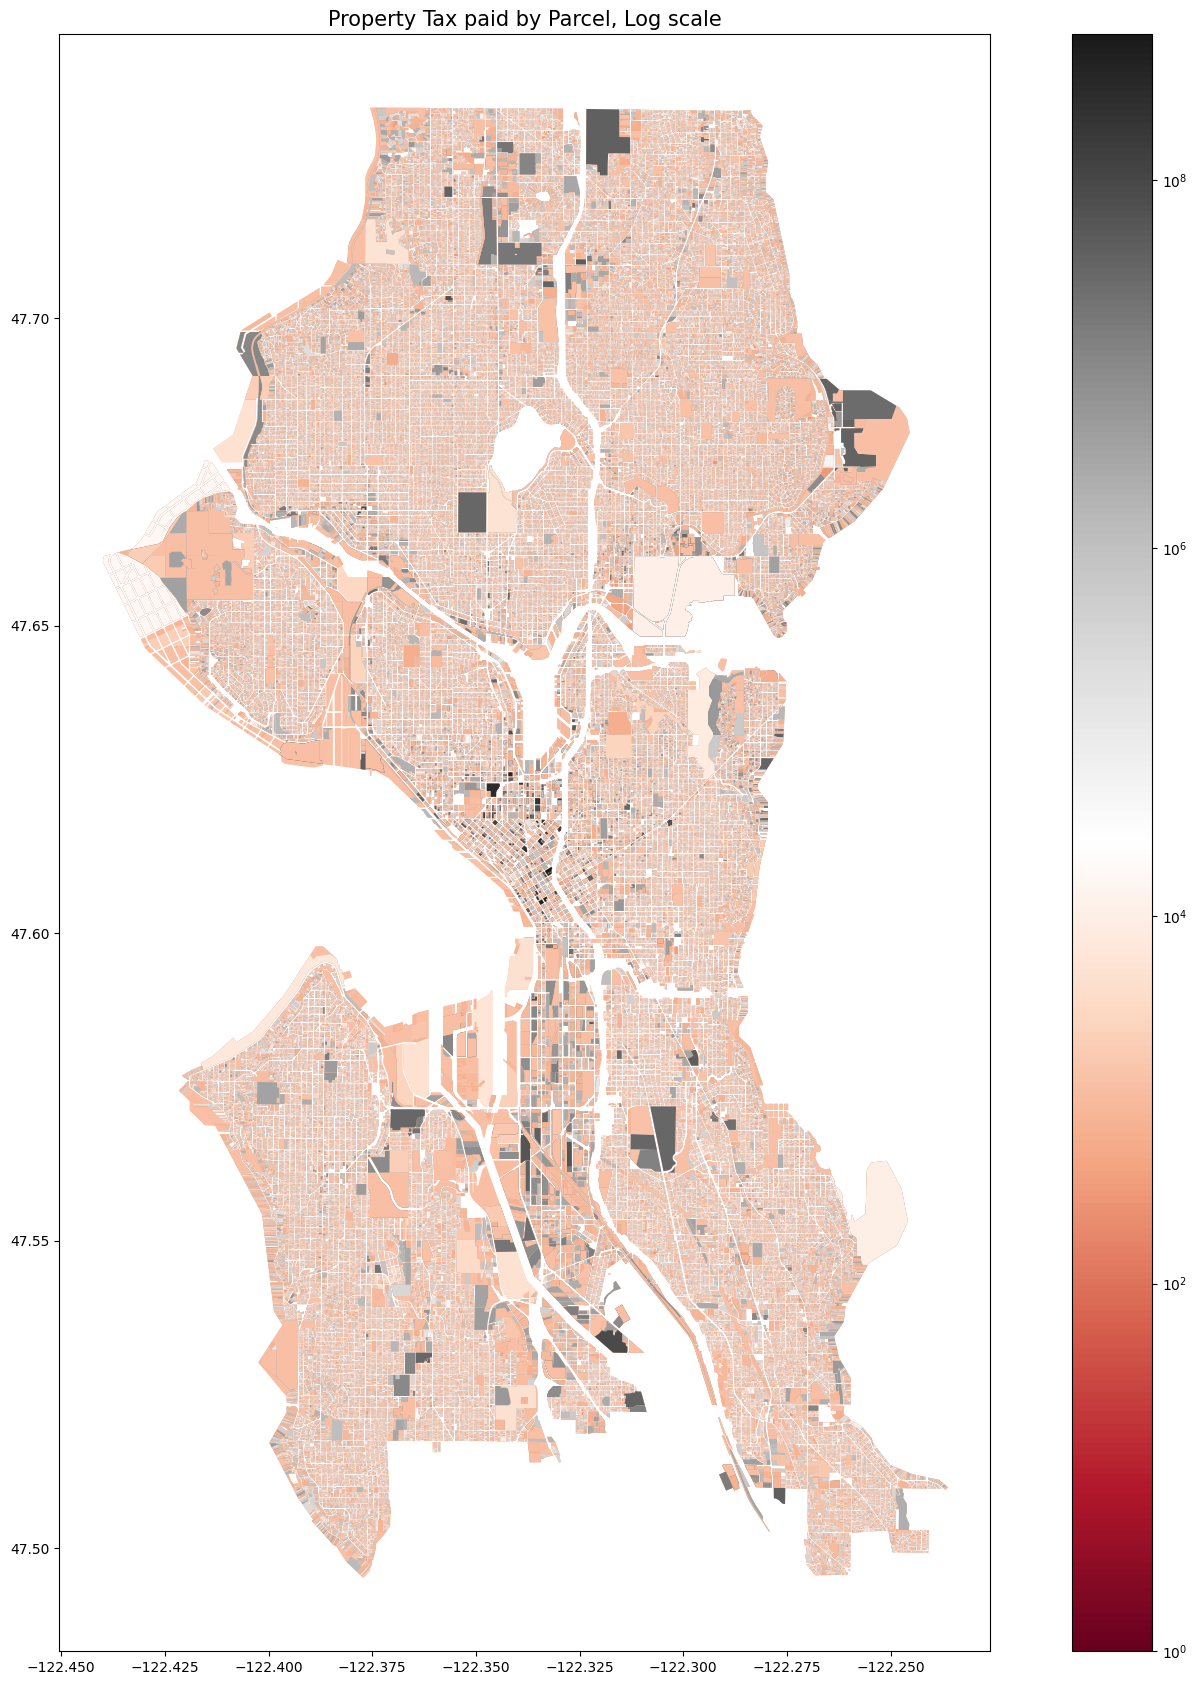
Now lets take a look at the Amount of Tax each individual parcel generates. Note that the scale on this chart and the following charts are logarithmic, meaning that the values increase more quickly than on a standard linear chart. Note the concentration of dark colors in various business centers around the city, including downtown. Also note that many of the largest parcels such as the Zoo near Greenlake, Magnusen park and many of the industrial parcels in SODO are high tax parcels.
In case you are wondering, the city’s highest paying parcel is the Columbia Tower in downtown Seattle, bringing in a whopping $622,098,534 in just one years worth of taxes.
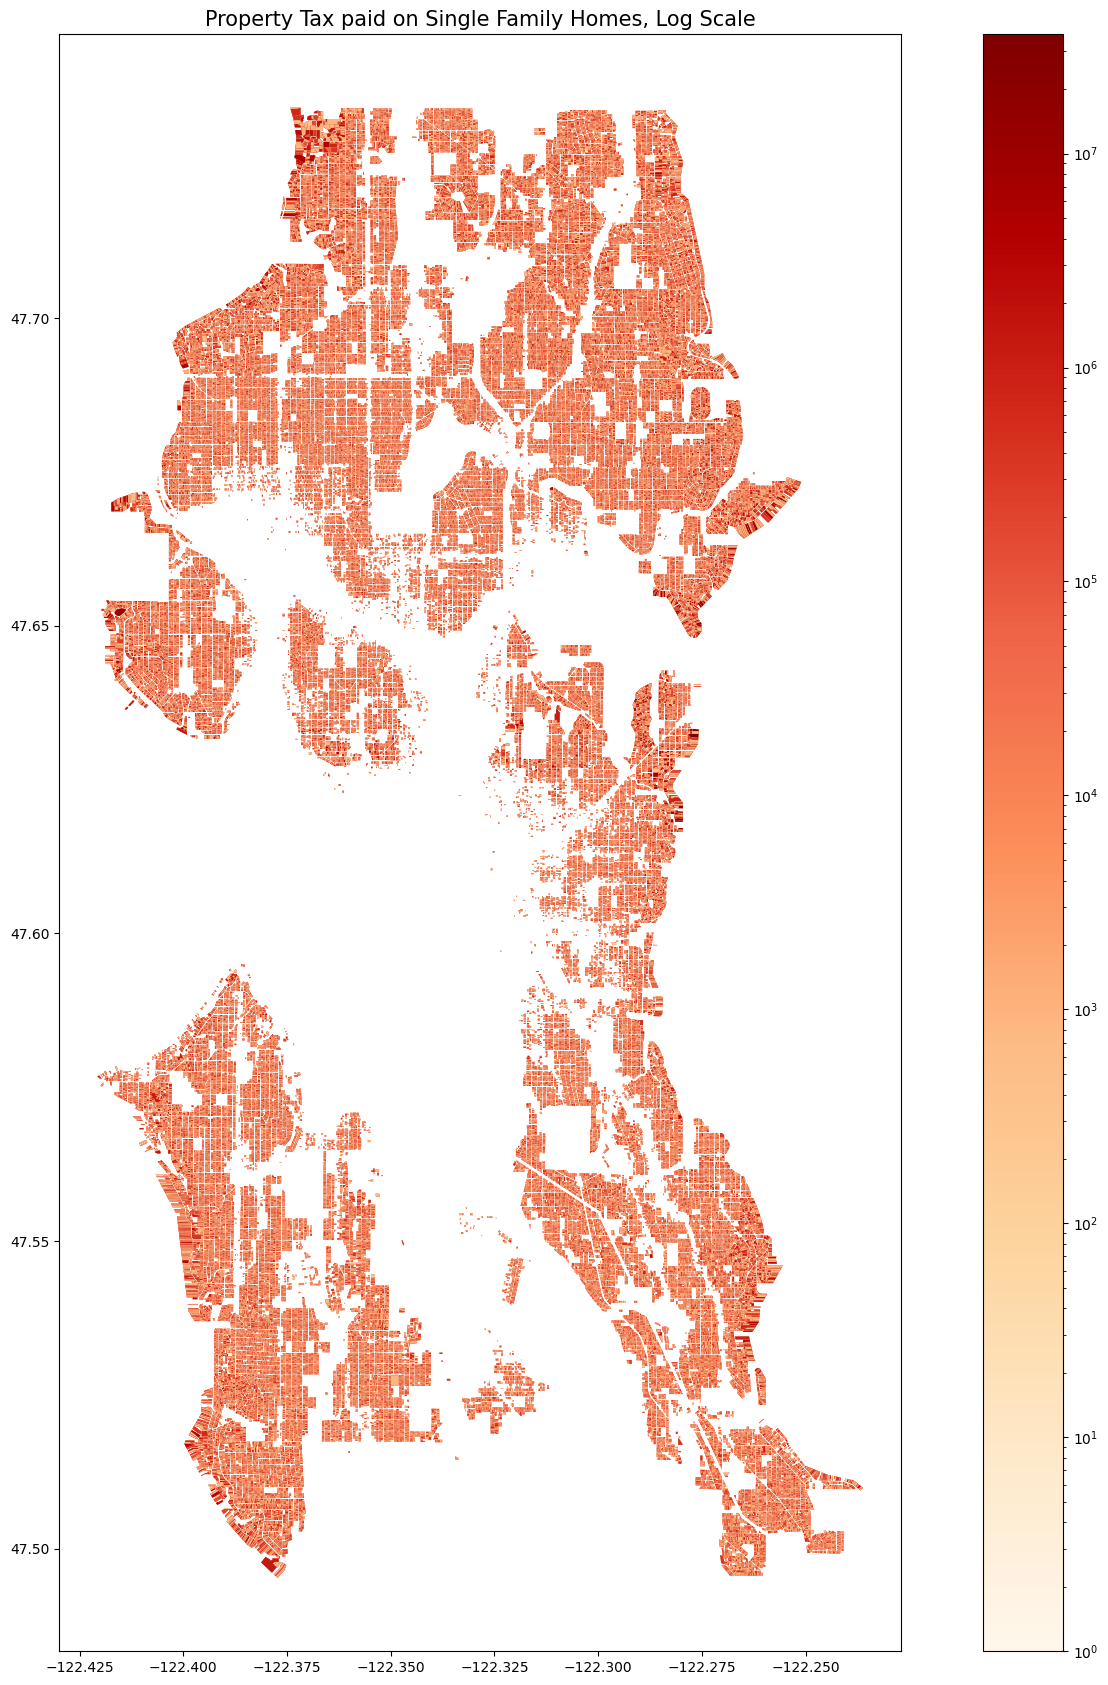
The next chart shows only single family homes, and wow there are a lot of them! 529,117 to be exact, representing a little over 70% of all land parcels in the city. Note that in the central business areas of the city there are almost no parcels designated as single family and also see that the deeper red color, signifying higher tax payments tend to be centered closer to the waterfront.
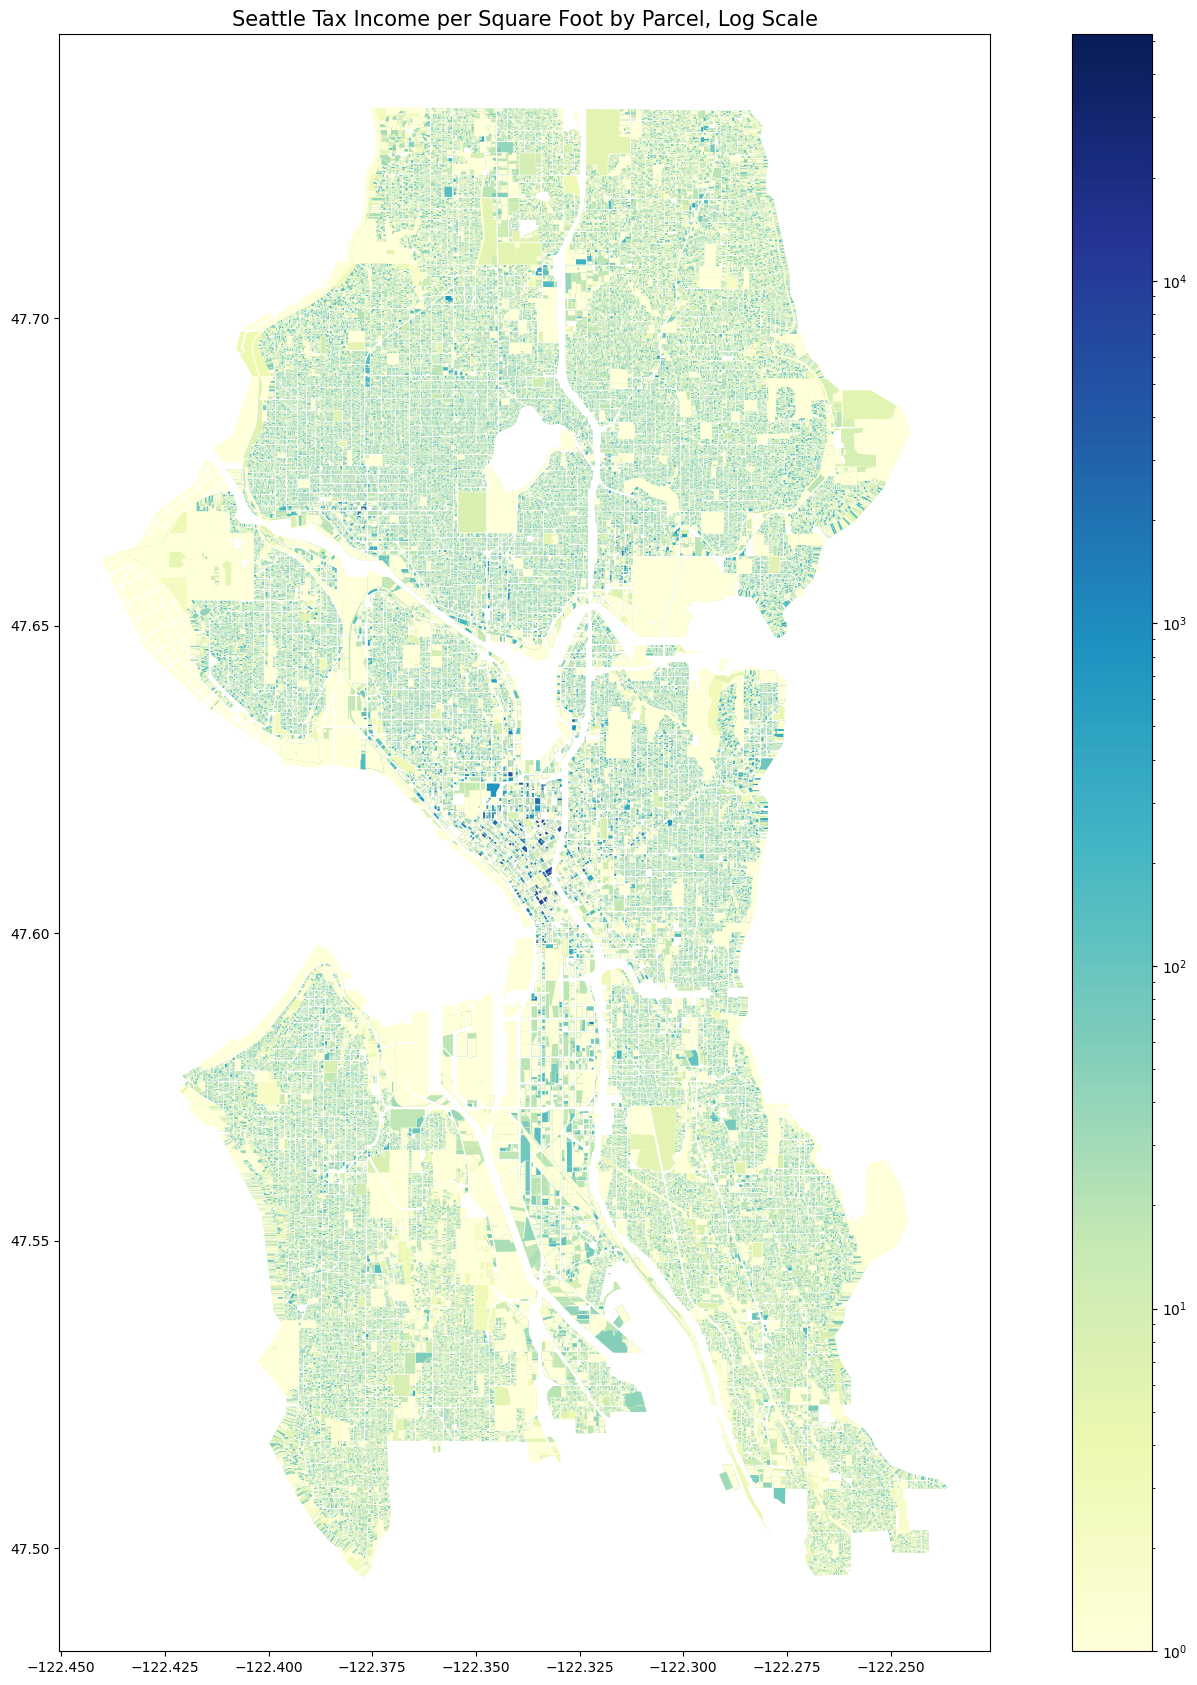
The final chart here is the tax value per square foot. It makes sense that a larger lot should generate more tax revenue, so now I am trying to control for that. We can still see darker colors centered towards business districts but a lot of the larger lots that in the prior chart looked like big earners are revealed to actually not bring in so much money per square foot!
To wrap things up, I have included a table with lots of numbers! This table has grouped the data by the 115 different distinctions made by the city and has the mean and total tax income for each category, the mean and total square footage by category the total number of parcels in each category and finally the most important column, the mean income per square foot! This final column was calculated by dividing the total tax income of the category by the total square footage of the category. Note that the table is ordered by the final column, meaning to most revenue generating per square foot categories are at the top of the table, and the least are at the bottom. Office buildings in historic zones are really money makers! Golf courses on the other hand…
| Property Type | Mean Tax Income per Parcel | Total Tax Income of Category | Mean SQFT By Category | Total SQFT By Category | Total Parcels In Category | Mean Income Per SQFT | |
|---|---|---|---|---|---|---|---|
| 0 | Historic Prop(Office) | 5,791,619 | 648,661,329 | 12,595 | 1,410,666 | 112 | 460 |
| 1 | Historic Prop(Eat/Drink) | 3,958,618 | 15,834,473 | 13,320 | 53,280 | 4 | 297 |
| 2 | Hotel/Motel | 6,980,964 | 3,986,130,454 | 27,973 | 15,972,660 | 571 | 250 |
| 3 | High Tech/High Flex | 6,516,954 | 78,203,444 | 29,260 | 351,116 | 12 | 223 |
| 4 | Office Building | 4,477,368 | 25,198,625,770 | 20,553 | 115,669,520 | 5628 | 218 |
| 5 | Apartment(Mixed Use) | 2,575,676 | 12,072,191,262 | 11,932 | 55,927,248 | 4,687 | 216 |
| 6 | Condominium(Office) | 3,173,909 | 187,260,634 | 21,836 | 1,288,297 | 59 | 145 |
| 7 | Apartment(Co-op) | 1,298,956 | 181,853,821 | 10,890 | 1,524,553 | 140 | 119 |
| 8 | Historic Prop(Retail) | 2,090,489 | 98,252,990 | 18,516 | 870,232 | 47 | 113 |
| 9 | Townhouse Plat | 147,025 | 13,477,817,942 | 1,357 | 124,385,952 | 91,670 | 108 |
| 10 | Skating Rink(Ice/Roller) | 19,787,299 | 79,149,195 | 183,343 | 733,372 | 4 | 108 |
| 11 | Apartment | 1,082,818 | 19,510,212,371 | 11,341 | 204,346,797 | 18,018 | 95 |
| 12 | Bowling Alley | 1,201,816 | 14,421,788 | 14,799 | 177,584 | 12 | 81 |
| 13 | Parking(Commercial Lot) | 826,262 | 906,409,703 | 10,515 | 11,534,922 | 1,097 | 79 |
| 14 | Retirement Facility | 2,471,215 | 862,453,962 | 31,613 | 11,032,871 | 349 | 78 |
| 15 | Medical/Dental Office | 1,283,403 | 1,074,208,208 | 17,337 | 14,510,972 | 837 | 74 |
| 16 | Parking(Garage) | 2,165,562 | 606,357,293 | 31,952 | 8,946,698 | 280 | 68 |
| 17 | Fraternity/Sorority House | 806,516 | 174,207,363 | 11,955 | 2,582,360 | 216 | 67 |
| 18 | Rooming House | 308,949 | 224,297,240 | 4,791 | 3,478,520 | 726 | 64 |
| 19 | Bed & Breakfast | 403,340 | 4,840,086 | 6,368 | 76,416 | 12 | 63 |
| 20 | Single Family(C/I Use) | 178,786 | 128,547,324 | 3,073 | 2,209,683 | 719 | 58 |
| 21 | Condominium(Mixed Use) | 1,202,283 | 1,251,576,670 | 20,741 | 21,591,677 | 1,041 | 58 |
| 22 | Tavern/Lounge | 336,025 | 86,358,323 | 5,969 | 1,534,015 | 257 | 56 |
| 23 | Mini Warehouse | 2,826,659 | 497,492,071 | 50,332 | 8,858,468 | 176 | 56 |
| 24 | Retail Store | 548,881 | 2,879,980,162 | 9,910 | 52,000,324 | 5,247 | 55 |
| 25 | Restaurant/Lounge | 471,777 | 760,976,561 | 8,520 | 13,743,307 | 1,613 | 55 |
| 26 | Bank | 960,189 | 376,393,974 | 17,680 | 6,930,516 | 392 | 54 |
| 27 | Grocery Store | 1,909,352 | 458,244,451 | 36,746 | 8,818,996 | 240 | 52 |
| 28 | Shopping Ctr(Community) | 12,180,665 | 438,503,933 | 244,656 | 8,807,624 | 36 | 50 |
| 29 | Shopping Ctr(Maj Retail) | 8,614,588 | 275,666,804 | 173,107 | 5,539,428 | 32 | 50 |
| 30 | Historic Prop(Misc) | 679,543 | 17,668,130 | 13,661 | 355,195 | 26 | 50 |
| 31 | Triplex | 257,972 | 1,459,863,067 | 5,278 | 29,869,788 | 5,659 | 49 |
| 32 | Retail(Line/Strip) | 752,106 | 47,533,1202 | 15,391 | 9,727,124 | 632 | 49 |
| 33 | Mini Lube | 559,694 | 17,910,195 | 11,646 | 372,656 | 32 | 48 |
| 34 | 4-Plex | 265,998 | 984,992,315 | 5,586 | 20,685,691 | 3,703 | 48 |
| 35 | Historic Prop(Loft/Warehse) | 692,297 | 5,538,377 | 14,716 | 117,728 | 8 | 47 |
| 36 | Auto Showroom and Lot | 1,414,459 | 355,029,153 | 30,654 | 7,694,168 | 251 | 46 |
| 37 | Single Family(C/I Zone) | 186,369 | 1,066,217,562 | 4,228 | 24,190,275 | 5,721 | 44 |
| 38 | Utility, Private(Radio/T.V.) | 1,118,563 | 71,588,020 | 25,576 | 1,636,864 | 64 | 44 |
| 39 | Duplex | 213,479 | 3,470,097,399 | 5,029 | 81,745,962 | 16,255 | 42 |
| 40 | Conv Store with Gas | 670,856 | 269,013,089 | 15,998 | 6,415,312 | 401 | 42 |
| 41 | Car Wash | 769,668 | 43,101,396 | 19,464 | 1,090,004 | 56 | 40 |
| 42 | Vet/Animal Control Srvc | 422,847 | 49,050,250 | 10,728 | 1,244,404 | 116 | 39 |
| 43 | Shopping Ctr(Nghbrhood) | 4,367,010 | 353,727,828 | 119,326 | 9,665,405 | 81 | 37 |
| 44 | Shell Structure | 314,554 | 44,037,585 | 8,803 | 1,232,356 | 140 | 36 |
| 45 | Service Station | 431,822 | 53,545,981 | 12,088 | 1,498,952 | 124 | 36 |
| 46 | Single Family(Res Use/Zone) | 224,167 | 117,166,872,259 | 6,280 | 3,282,378,700 | 522,677 | 36 |
| 47 | Historic Prop(Residence) | 309,201 | 16,696,837 | 8,750 | 472,480 | 54 | 35 |
| 48 | Shopping Ctr(Regional) | 9,041,911 | 36,167,645 | 257,194 | 1,028,776 | 4 | 35 |
| 49 | Restaurant(Fast Food) | 454,748 | 194,631,993 | 13,936 | 5,964,580 | 428 | 33 |
| 50 | Retail(Big Box) | 3,915,902 | 203,626,906 | 121,122 | 6,298,332 | 52 | 32 |
| 51 | Daycare Center | 347,781 | 55,992,699 | 10,815 | 1,741,143 | 161 | 32 |
| 52 | Gas Station | 465,880 | 3,727,044 | 14,966 | 119,728 | 8 | 31 |
| 53 | Houseboat | 520,320 | 132,161,305 | 16,758 | 4,256,645 | 254 | 31 |
| 54 | Office Park | 4,746,522 | 18,986,087 | 155,640 | 622,560 | 4 | 30 |
| 55 | Apartment(Subsidized) | 626,468 | 215,504,878 | 20,927 | 7,198,979 | 344 | 30 |
| 56 | Club | 1,073,621 | 184,662,864 | 36,321 | 6,247,285 | 172 | 30 |
| 57 | Conv Store without Gas | 309,045 | 38,321,621 | 10,484 | 1,300,060 | 124 | 29 |
| 58 | Parking(Assoc) | 334,646 | 757,304,581 | 12,445 | 28,162,276 | 2263 | 27 |
| 59 | Warehouse | 998,830 | 4,252,020,086 | 37,523 | 159,734,857 | 4,257 | 27 |
| 60 | Industrial(Lignt) | 954,604 | 1,030,972,013 | 37,690 | 40,705,404 | 1,080 | 25 |
| 61 | Service Building | 436,789 | 639,459,107 | 17,833 | 26,107,491 | 1,464 | 24 |
| 62 | Post Office/Post Service | 931,789 | 42,862,275 | 38,930 | 1,790,770 | 46 | 24 |
| 63 | Industrial(Gen Purpose) | 750,626 | 1,041,118,101 | 36,260 | 50,292,997 | 1,387 | 21 |
| 64 | Health Club | 811,855 | 70,631,385 | 43,107 | 3,750,344 | 87 | 19 |
| 65 | Retail(Discount) | 3,934,242 | 283,265,427 | 210,594 | 15,162,748 | 72 | 19 |
| 66 | Industrial Park | 3,563,503 | 267,262,724 | 194,954 | 14,621,549 | 75 | 18 |
| 67 | Historic Prop(Rec/Entertain) | 290,186 | 4,352,785 | 17,219 | 258,290 | 15 | 17 |
| 68 | Mobile Home | 117,292 | 3,284,172 | 7,189 | 201,304 | 28 | 16 |
| 69 | Movie Theater | 607,056 | 31,566,926 | 39,270 | 2,042,039 | 52 | 15 |
| 70 | Vacant(Commercial) | 259,587 | 804,718,286 | 17,211 | 53,354,535 | 3,100 | 15 |
| 71 | Industrial(Heavy) | 2,751,669 | 952,077,403 | 199,617 | 69,067,542 | 346 | 14 |
| 72 | Nursing Home | 1,248,681 | 78,666,900 | 98,527 | 6,207,209 | 63 | 13 |
| 73 | Greenhse/Nrsry/Hort Srvc | 594,043 | 10,692,774 | 49,804 | 896,476 | 18 | 12 |
| 74 | Group Home | 179,714 | 53,914,235 | 15,782 | 4,734,562 | 300 | 11 |
| 75 | Terminal(Auto/Bus/Other) | 1,289,123 | 139,225,246 | 119,798 | 12,938,233 | 108 | 11 |
| 76 | Vacant(Industrial) | 374,967 | 683,189,468 | 35,662 | 64,976,300 | 1,822 | 11 |
| 77 | Rehabilitation Center | 158,249 | 2,690,234 | 17,008 | 289,132 | 17 | 9 |
| 78 | Condominium(Residential) | 135,945 | 892,070,941 | 15,419 | 101,180,394 | 6,562 | 9 |
| 79 | Transferable Dev Rights | 238,368 | 953,474 | 28,283 | 113,132 | 4 | 8 |
| 80 | Vacant(Multi-family) | 111,072 | 366,092,413 | 13,976 | 46,064,519 | 3,296 | 8 |
| 81 | Driving Range | 2,001,712 | 8,006,846 | 311,538 | 1,246,152 | 4 | 6 |
| 82 | Auditorium//Assembly Bldg | 300,956 | 22,270,751 | 50,616 | 3,745,558 | 74 | 6 |
| 83 | Marina | 572,400 | 361,184,662 | 105,505 | 66,573,439 | 631 | 5 |
| 84 | Church/Welfare/Relig Srvc | 140,315 | 213,699,631 | 26,555 | 40,443,567 | 1,523 | 5 |
| 85 | Art Gallery/Museum/Soc Srvc | 288,552 | 35,491,926 | 54,735 | 6,732,435 | 123 | 5 |
| 86 | Mobile Home Park | 1,054,167 | 12,650,009 | 209,767 | 2,517,204 | 12 | 5 |
| 87 | Park, Private(Amuse Ctr) | 163,214 | 6,854,982 | 33,040 | 1,387,683 | 42 | 5 |
| 88 | Historic Prop(Vacant Land) | 301,130 | 2,107,910 | 61,215 | 428,504 | 7 | 5 |
| 89 | Hospital | 1,339,300 | 113,840,462 | 288,284 | 24,504,156 | 85 | 5 |
| 90 | Terminal(Rail) | 567,345 | 161,693,322 | 128,780 | 36,702,395 | 285 | 4 |
| 91 | School(Private) | 198,855 | 90,677,845 | 45,839 | 20,902,547 | 456 | 4 |
| 92 | Sport Facility | 777,929 | 128,358,306 | 187,238 | 30,894,277 | 165 | 4 |
| 93 | Easement | 42,062 | 3,154,627 | 10,964 | 822,332 | 75 | 4 |
| 94 | Residence Hall/Dorm | 153,987 | 21,866,173 | 40,406 | 5,737,605 | 142 | 4 |
| 95 | Right of Way/Utility, Road | 218,047 | 253,588,974 | 58,627 | 68,183,501 | 1,163 | 4 |
| 96 | Governmental Service | 322,776 | 205,931,252 | 118,337 | 75,499,224 | 638 | 3 |
| 97 | Open Space Tmbr Land/Greenbelt | 222,522 | 1,780,175 | 82,752 | 662,020 | 8 | 3 |
| 98 | Utility, Public | 228,672 | 206,719,438 | 89,198 | 80,634,904 | 904 | 3 |
| 99 | Vacant(Single-family) | 56,140 | 1,215,665,171 | 22,257 | 481,955,277 | 21,654 | 3 |
| 100 | School(Public) | 767,800 | 555,119,368 | 311,557 | 225,255,811 | 723 | 2 |
| 101 | Historic Prop(Park/Billbrd) | 30,358 | 242,866 | 13,388 | 107,108 | 8 | 2 |
| 102 | Mortuary/Cemetery/Crematory | 947,087 | 95,655,792 | 455,081 | 45,963,174 | 101 | 2 |
| 103 | Terminal(Marine) | 414,055 | 157,340,829 | 225,682 | 85,759,271 | 380 | 2 |
| 104 | Air Terminal and Hangers | 1,385,789 | 48,502,632 | 788,968 | 27,613,863 | 35 | 2 |
| 105 | Golf Course | 2,519,324 | 191,468,642 | 1,726,738 | 131,232,108 | 76 | 1 |
| 106 | Terminal(Marine/Comm Fish) | 799,173 | 80,716,454 | 624,959 | 6,3120,842 | 101 | 1 |
| 107 | River/Creek/Stream | 139,095 | 834,569 | 118,950 | 713,697 | 6 | 1 |
| 108 | Park, Public(Zoo/Arbor) | 375,615 | 502,196,909 | 368,967 | 493,308,801 | 1,337 | 1 |
| 109 | Open Space(Agric-RCW 84.34) | 40,260 | 322,082 | 48,330 | 386,640 | 8 | 1 |
| 110 | Reserve/Wilderness Area | 62,868 | 440,073 | 86,014 | 602,095 | 7 | 1 |
| 111 | Open Space(Curr Use-RCW 84.34) | 20,108 | 764,116 | 131,947 | 5,014,003 | 38 | 0 |
| 112 | Water Body, Fresh | 622 | 7,462 | 23,704 | 284,454 | 12 | 0 |
| 113 | Tideland, 2nd Class | 425 | 15,737 | 21,190 | 784,047 | 37 | 0 |
| 114 | Tideland, 1st Class | 843 | 294,256 | 74,776 | 26,096,959 | 349 | 0 |
Thanks for reading! All data was provided by King County, find the tax data here, and the parcel data here. All the tax data is from 2023.
Also, check out the code I used to make this post here!