When it rains we bike??
A quick study of how Seattleites respond to rain
Seattle is a famously rainy city. And Seattleites famously love the rain! Or hate it?? Hard to say.
Since March of 2013, it has preciptated 1998 days in Seattle. Thats a bit more that 51% percent!!
Also since March of 2013, 9,907,160 people have biked across the Fremont Bridge, nearly ten mllion people!
In those 3823 days, that is an average of 2591.5 cyclists per day.
Now let’s look at some of the plots I made with these data.
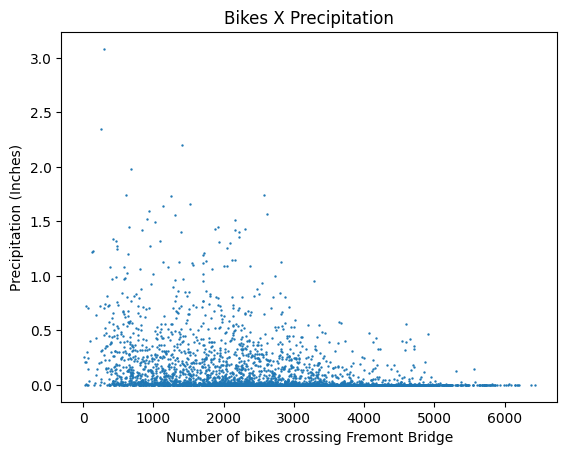
This scatter plot shows the amount of bikes that crossed the Fremont bridge on the X axis and the inches of rain on the Y.
Note how there is a trend towards the upper left region of the graph and the lower right.
This means that when there is a lot of rain, there is less bike traffic and when there is no rain there is likely to be more.
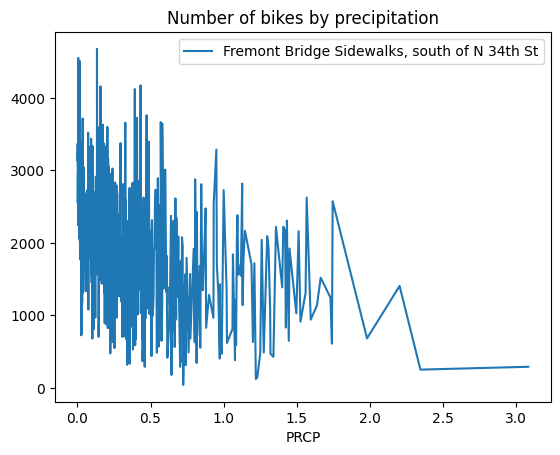
Those correlations are even more clear when we look at the average amount of bikers at every quantity of rain.
And even more clear, when we look at the rounded version of that, with the rain grouped together in 30 categories rather than 3000.
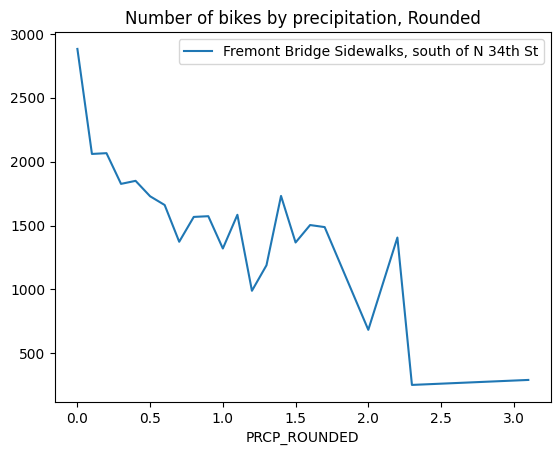
Above we can see the steady decrease in bikers as the rain increases. Note that the data towards the rainier side of the graph is more vairable due to significantly less data points.
The average number of bikes on days it did not rain was 3140.7 and 2098.8 when there was even a drop of rain detected. Almost a 50% difference!
I suppose this all goes to show that we may not be quite as rain loving as it may appear.
Thanks to our public records for providing these data! I got the climate data from NCDC/NOAA
and the bike data from the [City of Seattle].(https://data.seattle.gov/Transportation/Fremont-Bridge-Bicycle-Counter/65db-xm6k)
Check out the code that produced this post here