A study of American individual debt by county
For this quick study I combined a simple data set of centroid data for all American counties with a Dataset containing many different metrics, most of them surrounding debt. With these two different points of view I was able to visualize what types of qualities and issues different parts of the USA hold.
Let’s take a look at a few of them below:
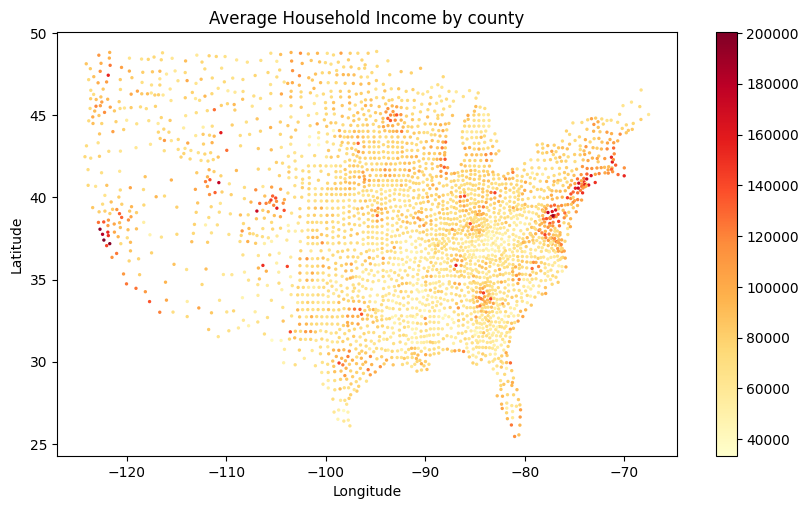
First, let’s look at the average household income. You can see higher incomes centered around large cities, specifically on the Eastern seaboard and in California.
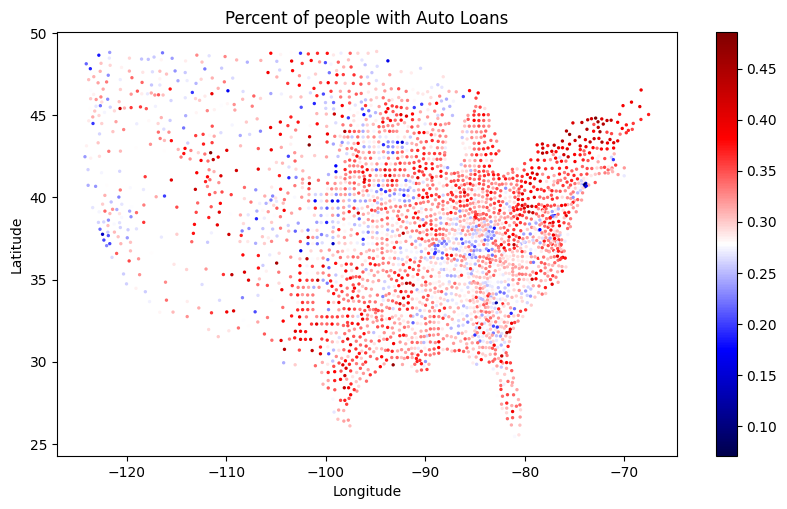
Next, we can look at the percent of people across the nation who have Auto Loans at all. This metric could depend on many different things such as the wealth of a region, the car ownership necessity of a region and more.
We see below how on both the county and state level, loan delinquency is correlated with household income.
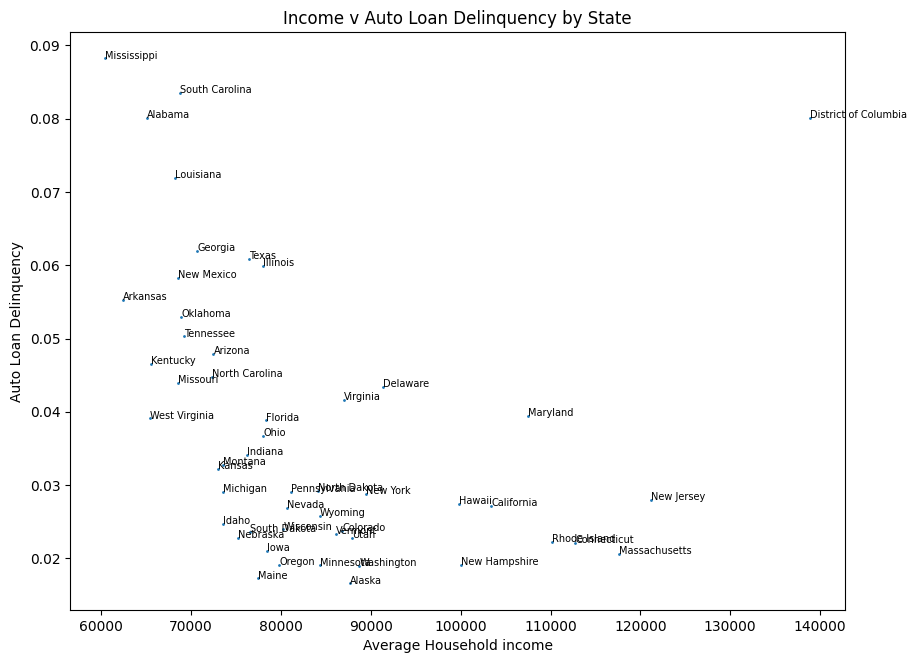
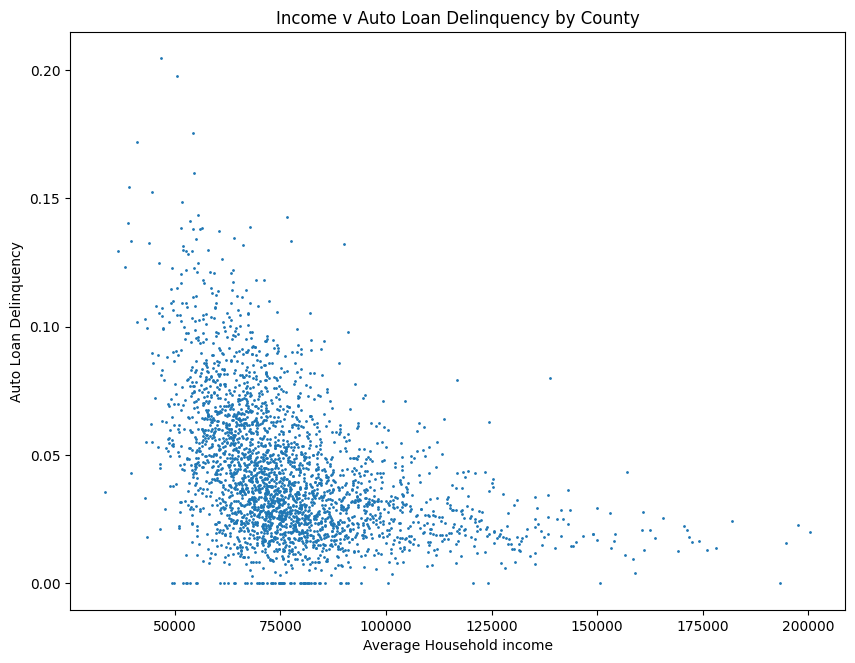
Naturally, we see the delinquency rate fall significantly as the average household income rises. Let’s take a look visually.
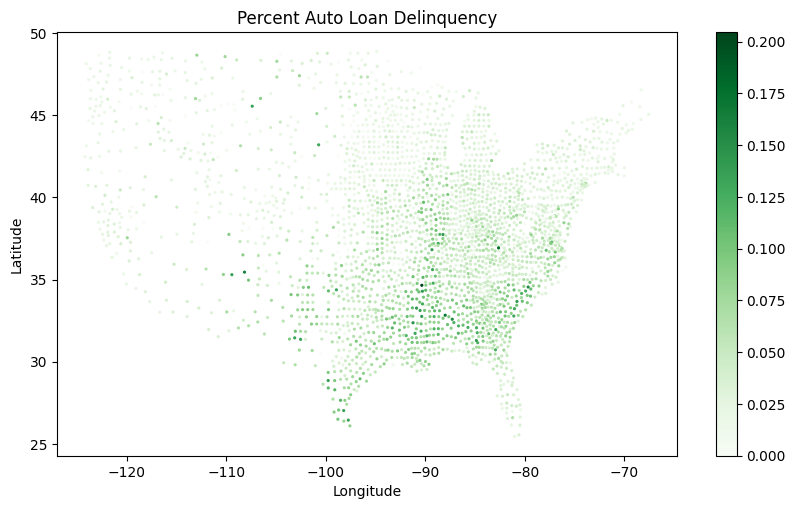
We can see that the darker green is more concentrated in the southeast of the United States than the regions with low household income, which are very spread out.
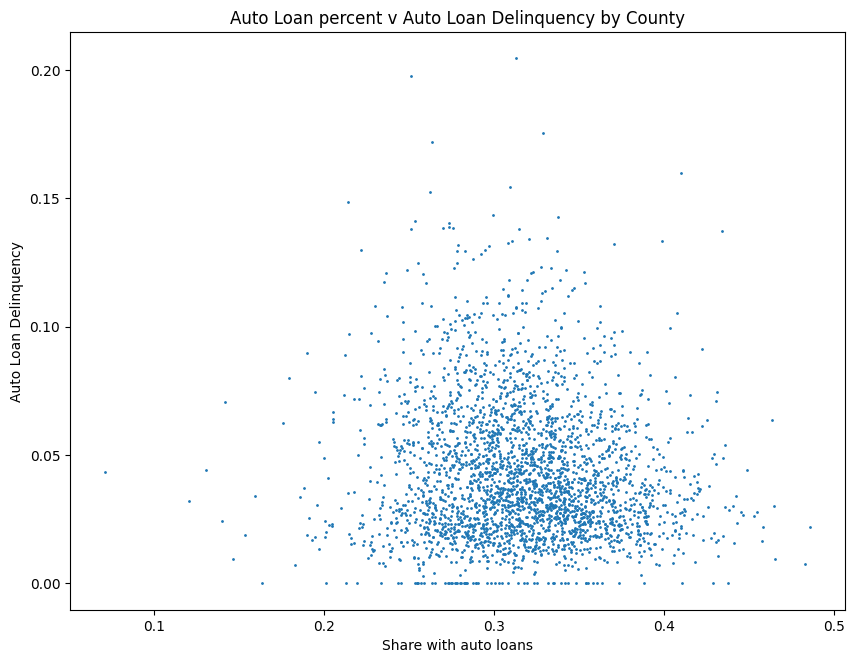
This graph, the percent of people with Auto Loans looks quite different than the percent of loan delinquency. See below that the correlation between the two variables is extremely weak or perhaps nonexistent.
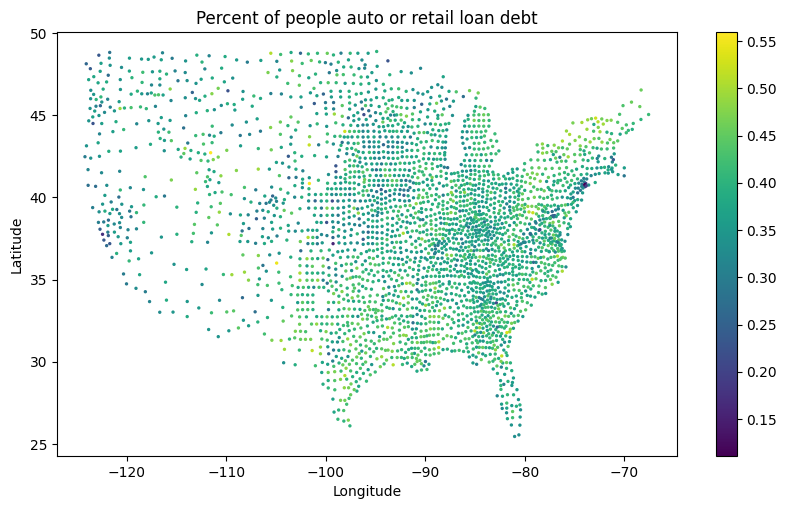
Finally lets look at the percent of people by county with auto or retail Debt. We see an average of 38.5% nationally, with 27 counties across the nation exceeding 50% in some kind of auto or retail Debt.
Thanks for reading!
Check out my sources for the geographic data and the [economic data].(https://datacatalog.urban.org/dataset/debt-america-2023)
See the source code on my github [here].(https://github.com/amschechter/amschechter.github.io/blob/main/DataScience/censusData/AutoDebt.ipynb)