Examining IH - 35 through central Austin!
I - 35 Sucks! A study
IH - 35 cuts a gash through central Austin. I have used data provided by the city of Austin and the State of Texas to attempt to display that as it currently exists, I-35 is particularly dangerous.
I used the same data set that is used by Vision Zero, the city’s initiative to reduce traffic injuries/deaths. All the data I am using here, unless otherwise specified begins in October of 2013 and ends in October of 2023. You can use the Vision Zero dashboard to look at stats yourself, check out their website here. They have lots of lovely visualizations that you can modify.
To do this analysis, I used Python in Jupyter Notebooks.
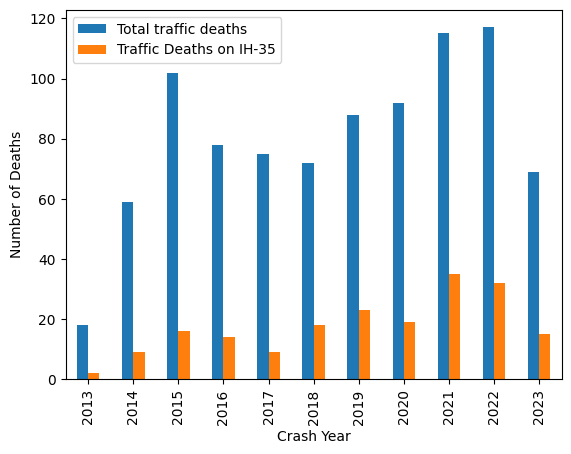
Let’s start with a simple graph. This one displays the amount of total fatalities that occurred in Austin, and the amount of fatalities that occurred on I-35.
The next graph displays the same data but divided by each other. This lines in the graph below represent the percent of all crashes in Austin that occured on I-35. The higher the bar, the more happened on the highway.
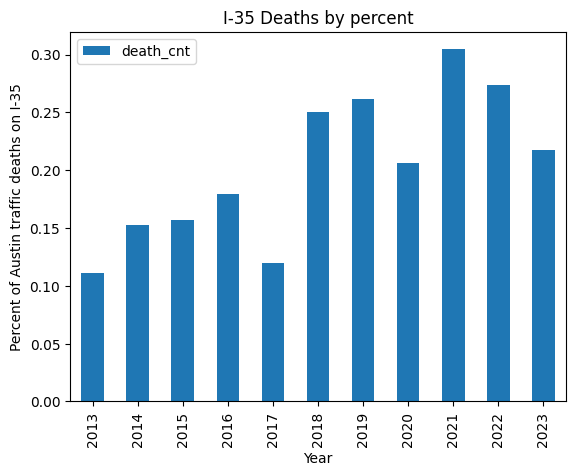
As you can see, percent fluctuates because the numbers aren’t huge. However, we can see a steady rise year by year.
The percent of deaths that occur on IH-35 is considerably larger than both the percent of injuries and the percent of total traffic incidents. In fact, 21.7 percent of the data set’s fatalities were on I-35 ( 192 / 885), whereas only 17.3 percent of the injuries and (16543 / 95697) and 17.0 percent of the total traffic incidents (25263 / 148579) were on I-35. These numbers are large enough that it is a clear indication that a crash on I-35 is more deadly than a crash elsewhere.
Heatmaps
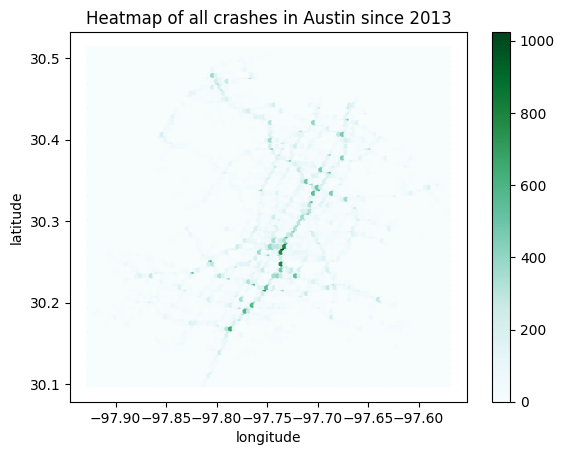
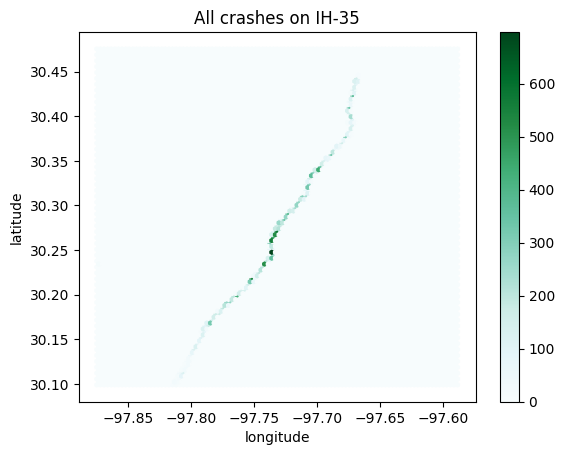
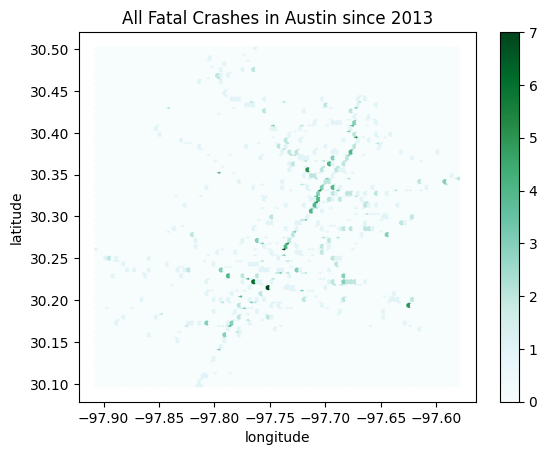
Above, you see three different heatmaps. The first represents every traffic incident in the entire data set, the second shows all the crashes that occurred on IH-35 and the third shows the location of all fatal crashes. The darker the color on the map means more incidents occurred in that location. As you can see the scale on the right is quite different in all three graphs.
Economic Loss
An additional factor is the shocking economic loss caused by I-35. The State of Texas uses the ‘National Safety Councils’ injury facts to calculate this, check out their website (here)[https://injuryfacts.nsc.org/all-injuries/costs/guide-to-calculating-costs/data-details/]. See this (report)[https://www.txdot.gov/data-maps/crash-reports-records/motor-vehicle-crash-statistics.html] or this (pdf)[https://ftp.txdot.gov/pub/txdot-info/trf/crash_statistics/2022/a.pdf], both made by TXDOT to see this economic loss calculation in action. I will be using the same method to calculate economic loss caused by IH-35.
In 2022 alone, there were 32 deaths on I-35 which were responsible for $399,168,000 in economic loss! It is not a good feeling to quantify monetarily the loss of life, but when we are talking about nearly 400 million dollars it is a pretty big deal. Bear in mind that this is using the 2021 statistic, so with the 2023 numbers it would be well over 400 million.
This is also not taking into account serious injuries. In 2022 there were 2282 injuries described as ‘Incapacitating’ which resulted in an economic loss of $2,318,512,000. Thats over 2.3 billion dollars!!
Conclusion
Traffic in Austin is bad. I-35 is worse. Expanding the highway will cause more and more injuries, worsening what is already Austin’s biggest killer.